benchmark_runner 1.0.0  benchmark_runner: ^1.0.0 copied to clipboard
A library for writing inline micro-benchmarks, running sync/async benchmarks, reporting and exporting score statistics.
Benchmark Runner #
Introduction #
Benchmarking is used to estimate and compare the execution speed of
numerical algorithms and programs.
The package benchmark_runner is based on
benchmark_harness and includes helper
functions for writing inline micro-benchmarks with the option of
printing a score histogram and reporting the score mean ±
standard deviation, and score median ± inter quartile range.
The benchmark runner allows executing several benchmark files and reports if uncaught exceptions/errors were encountered.
Usage #
Include benchmark_runner as a dev_dependency
in your pubspec.yaml file.
Write inline benchmarks using the functions:
benchmark: Creates and runs a synchronous benchmark and reports the benchmark score.asyncBenchmark: Creates and runs an asynchronous benchmark.group: Used to label a group of benchmarks. The callbackbodyusually contains one or several calls tobenchmarkandasyncBenchmark. Benchmark groups may not be nested.- Benchmark files must end with
_benchmark.dartin order to be detected by thebenchmark_runner.
The example below shows a benchmark file containing synchronous and asynchronous benchmarks.
// ignore_for_file: unused_local_variable

import 'package:benchmark_runner/benchmark_runner.dart';

/// Returns the value [t] after waiting for [duration].
Future<T> later<T>(T t, [Duration duration = Duration.zero]) {
  return Future.delayed(duration, () => t);
}

void main(List<String> args) async {
  await group('Wait for duration', () async {
    await asyncBenchmark('10ms', () async {
      await later<int>(39, Duration(milliseconds: 10));
    });

    await asyncBenchmark('5ms', () async {
      await later<int>(27, Duration(milliseconds: 5));
    }, emitStats: false);
  });

  group('Set', () async {
    await asyncBenchmark('error test', () {
      throw ('Thrown in benchmark.');
    });

    benchmark('construct', () {
      final set = {for (var i = 0; i < 1000; ++i) i};
    });

    throw 'Error in group';
  });
}
1. Running a Single Benchmark File #
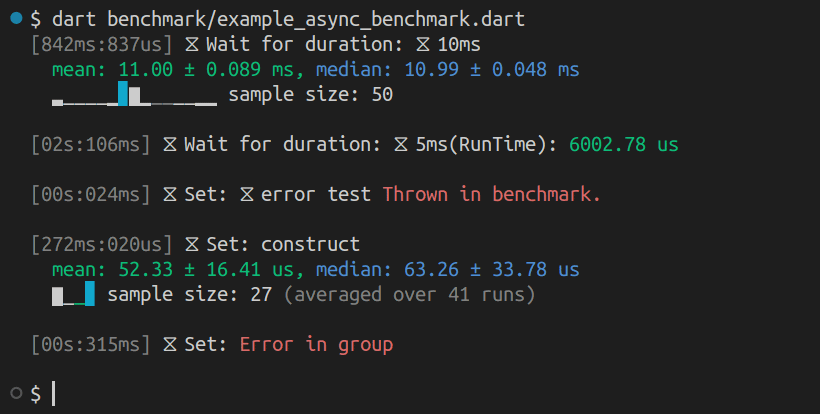
A single benchmark file may be run as a Dart executable:

The console output is shown above. By default,
the functions benchmark and
asyncBenchmark
emit benchmark score statistics.
- The first column shows the micro-benchmark runtime, followed by the group name and the benchmark name.
- The labels of asynchronous groups and benchmarks are marked with an hour-glass symbol.
- The mean and the histogram block containing the mean are printed using green foreground.
- The median and the block containg the median are printed using blue foreground.
- If the same block contains mean and median then it is printed using cyan foreground.
- Errors are printed using red foreground.
2. Using the Benchmark Runner #
To run several benchmark files (with the format*_benchmark.dart)
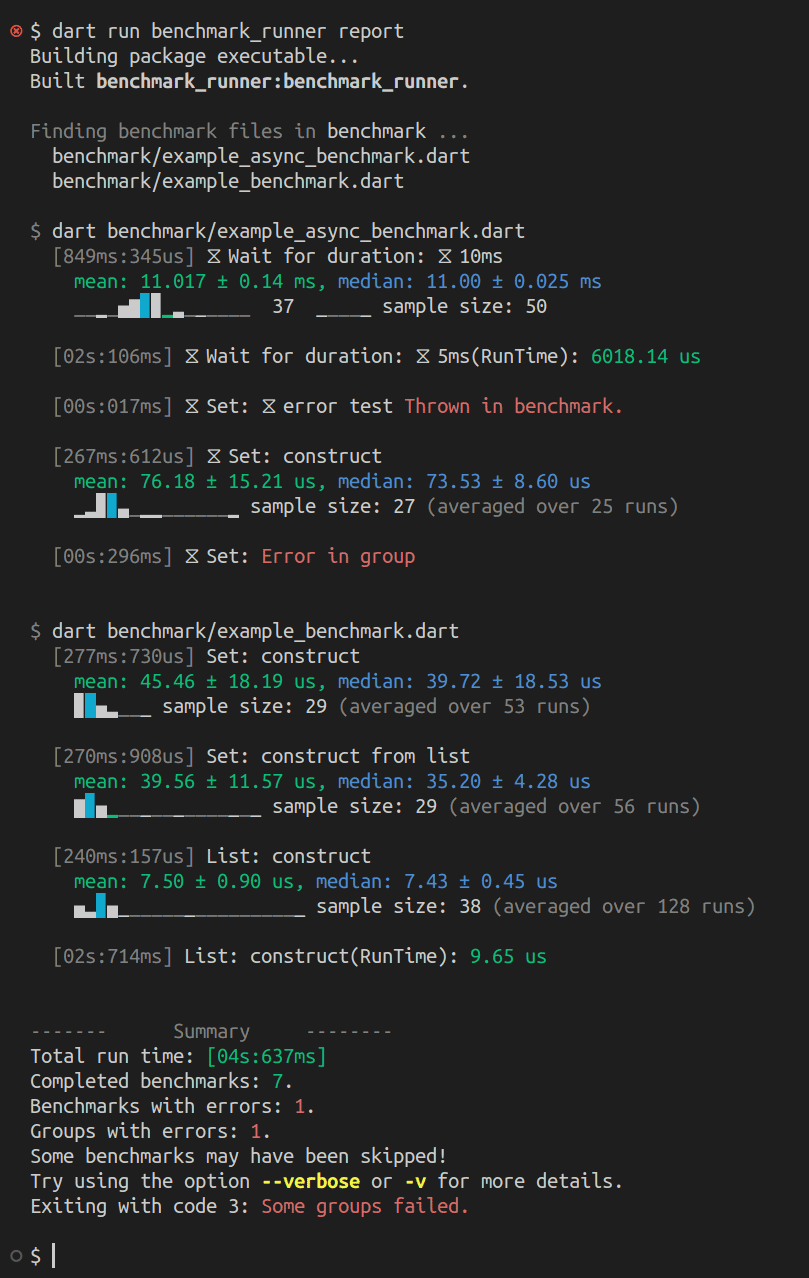
and print a report, invoke the sub-command report and specify a directory.
If no directory is specified, it defaults to benchmark:

A typical console output is shown above. In this example, the benchmark_runner detected two benchmark files, ran the micro-benchmarks and produced a report.
- The summary shows the total number of completed benchmarks, the number of benchmarks with errors and the number of groups with errors (that do not occur within the scope of a benchmark function).
- To show a stack trace for each error, use the option
-vor--verbose. - The total benchmark run time may be shorter than the sum of the micro-benchmark run times since each executable benchmark file is run in a separate process.
3. Exporting Benchmark Scores #
To export benchmark scores use the sub-command export:
$ dart run benchmark_runner export --outputDir=scores --extension=csv searchDirectory
In the example above, searchDirectory is scanned for *_benchmark.dart
files. For each benchmark file a corresponding file *_benchmark.csv is
written to the directory scores. The directory must exist and the user
must have write access.
Note: When exporting benchmark scores to a file
and the emitter output is colorized,
it is recommended to use the option --isMonochrome, to
avoid spurious characters due to the use of Ansi modifiers.
Since version 1.0.0, the functions benchmark and
asyncBenchmark accept the optional parameters emitter and
report. These parameters can be used to customize the score reports e.g.
to make the score format more suitable for writing to a file:
import 'package:benchmark_runner/benchmark_runner.dart';

class CustomEmitter extends ColorPrintEmitter {
  void emitMean({required Score score}) {
    print('# Mean               Standard Deviation');
    print('${score.stats.mean}  ${score.stats.stdDev}');
  }
}

void main(){
  benchmark(
      'construct list | use custom emitter',
      () {
        var list = <int>[for (var i = 0; i < 1000; ++i) i];
      },
      emitter: CustomEmitter(),
      report: (instance, emitter) => emitter.emitMean(
        score: instance.score(),
      ),
    );
}
Tips and Tricks #
-
The scores reported by
benchmarkandasyncBenchmarkrefer to a single run of the benchmarked function. -
Benchmarks do not need to be enclosed by a group.
-
A benchmark group may not contain another benchmark group.
-
The program does not check for group description and benchmark description clashes. It can be useful to have a second benchmark with the same name for example to compare the standard score as reported by
benchmark_harnessand the score statistics. -
By default,
benchmarkandasyncBenchmarkreport score statistics. In order to generate the report provided bybenchmark_harnessuse the optional argumentreport: reportMean. -
Color output can be switched off by using the option:
--isMonochromeor-mwhen calling the benchmark runner. When executing a single benchmark file the corresponding option is--define=isMonochrome=true. -
The default colors used to style benchmark reports are best suited for a dark terminal background. They can, however, be altered by setting the static variables defined by the class
ColorProfile. In the example below, the styling of error messages and the mean value is altered.import 'package:ansi_modifier/ansi_modifier.dart'; import 'package:benchmark_runner/benchmark_runner.dart'; void customColorProfile() { ColorProfile.error = Ansi.red + Ansi.bold; ColorProfile.mean = Ansi.green + Ansi.italic; } void main(List<String> args) { // Call function to apply the new custom color profile. customColorProfile(); } -
When running asynchronous benchmarks, the scores are printed in order of completion. The print the scores in sequential order (as they are listed in the benchmark executable) it is required to await the completion of the async benchmark functions and the enclosing group.
Score Sampling #
In order to calculate benchmark score statistics a sample of scores is required. The question is how to generate the score sample while minimizing systematic errors (like overheads) and keeping the benchmark run times within acceptable limits.
To estimate the benchmark score the functions warmup
or warmupAsync are run for 200 milliseconds.
1. Default Sampling Method #
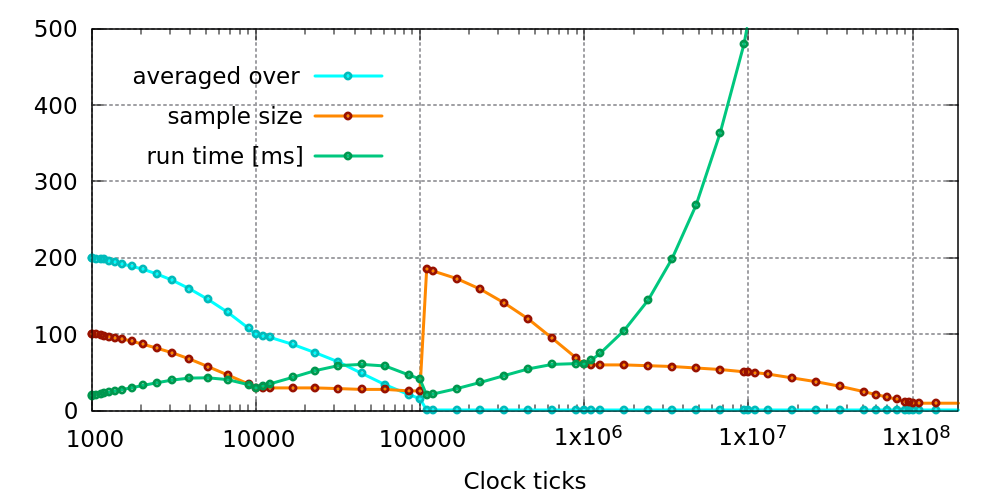
The graph below shows the sample size (orange curve) as calculated by the function
BenchmarkHelper.sampleSize.
The green curve shows the lower limit of the total microbenchmark duration and
represents the value: clockTicks * sampleSize * innerIterations.

For short run times below 100000 clock ticks each sample score is generated
using the functions measure or the equivalent asynchronous method measureAsync.
The parameter
ticks used when calling the functions measure and
measureAsync is chosen such that the benchmark score is
averaged over (see the cyan curve in the graph above):
- ticks < 1000 => 200 runs,
- 1000 < ticks < 1e4 => 200 ... 100 runs (exponentialy interpolated),
- 1e4 < ticks < 1e5 => 100 ... 20 runs (exponentially interpolated),
- ticks > 1e5 => No preliminary averaging of sample scores.
2. Custom Sampling Method #
To amend the score sampling process the static function
BenchmarkHelper.sampleSize can be replaced with a custom function:
BenchmarkHelper.sampleSize = (int clockTicks) {
  return (outer: 100, inner: 1)
}
To restore the default score sampling settings use:
BenchmarkHelper.sampleSize = BenchmarkHelper.sampleSizeDefault;
The graph shown above may be re-generated using the custom sampleSize
function by copying and amending the file gnuplot/sample_size.dart
and using the command:
dart sample_size.dart
The command above lauches a process and runs a gnuplot script.
For this reason, the program gnuplot must be installed (with
the qt terminal enabled).
Contributions #
Help and enhancement requests are welcome. Please file requests via the issue tracker.
The To-Do list currently includes:
-
Add tests.
-
Add color profiles optimized for terminals with light background color.
-
Improve the way benchmark score samples are generated.
Features and bugs #
Please file feature requests and bugs at the issue tracker.