vector_map 0.5.0  vector_map: ^0.5.0 copied to clipboard
Vector map for Flutter. Highly customizable. Compatible with GeoJSON. Map chart. Pure Flutter.

Vector Map #
- Compatible with GeoJSON
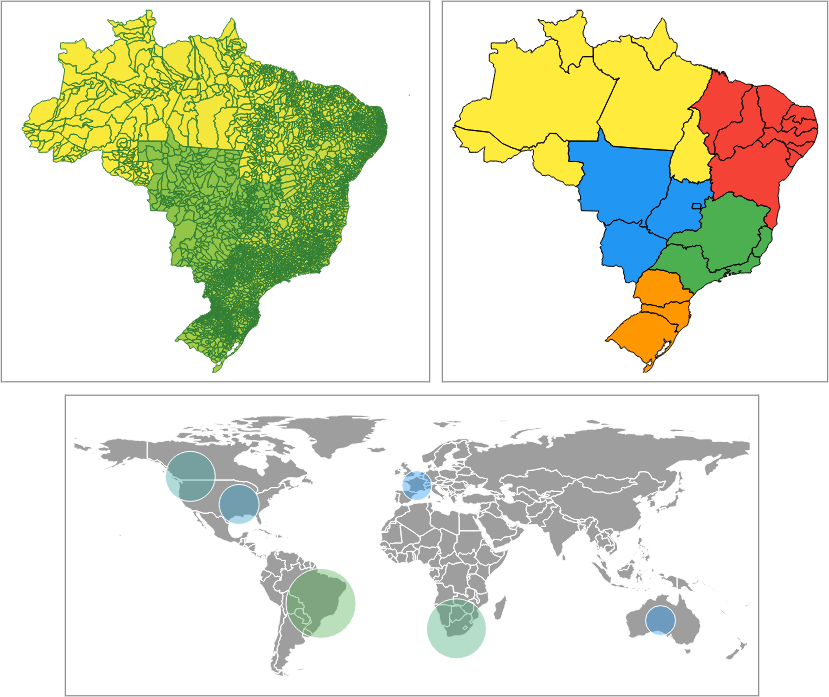
- Multi resolution with geometry simplification
- Highly customizable
- High performance
- Interactable
- Pure Flutter (no WebView/JavaScript)
Usage #
- About the examples
- Reading GeoJSON from String
- Reading GeoJSON properties
- Creating the Widget
- Theme
- Highlight theme
- Contour thickness
- Cursor hover
- Layers
- Marker
- Addons
- Click listener
- Debugger
About the examples #
Simplified GeoJSONs will be used in the examples to demonstrate package usage. The following examples will assume that GeoJSONs have already been loaded into Strings. The full code is at https://github.com/caduandrade/vector_map_flutter_demo.
polygons.json (link)
| Name | Seq | Rnd | Gts |
|---|---|---|---|
| "Einstein" | 1 | "73" | 15000 |
| "Newton" | 2 | "92" | 7500 |
| "Galileu" | 3 | "10" | 3000 |
| "Darwin" | 4 | 15000 | |
| "Pasteur" | 5 | "77" | 17000 |
| "Faraday" | 6 | "32" | 17500 |
| "Arquimedes" | 7 | "87" | 25000 |
| "Tesla" | 8 | "17" | 12500 |
| "Lavoisier" | 9 | 4000 | |
| "Kepler" | 10 | "32" | 18000 |
| "Turing" | 11 | "93" | 31400 |
points.json (link)
| Name | AN |
|---|---|
| "Titanium" | 22 |
| "Niobium" | 41 |
| "Carbon" | 6 |
| "Neon" | 10 |
| "Silicon" | 14 |
| "Hydrogen" | 1 |
Reading GeoJSON from String #
Reading the geometries only.
    MapDataSource polygons =
        await MapDataSource.geoJSON(geojson: polygonsGeoJSON);
Reading GeoJSON properties #
The keys argument defines which properties must be loaded.
The parseToNumber argument defines which properties will have numeric values in quotes parsed to numbers.
The labelKey defines which property will be used to display its values as feature labels.
    MapDataSource polygons = await MapDataSource.geoJSON(
        geojson: polygonsGeoJSON,
        keys: ['Seq', 'Rnd'],
        parseToNumber: ['Rnd'],
        labelKey: 'Rnd');
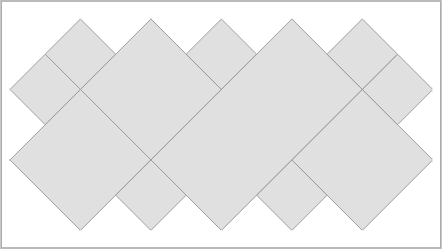
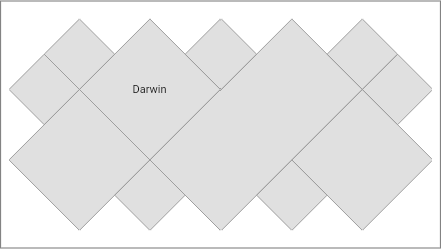
Creating the Widget #
    MapLayer layer = MapLayer(dataSource: polygons);

    VectorMap map = VectorMap(layers: [layer]);
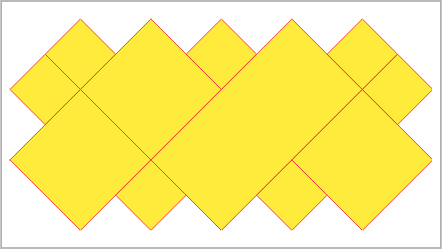
Theme #
    MapLayer layer = MapLayer(
        dataSource: polygons,
        theme: MapTheme(color: Colors.yellow, contourColor: Colors.red));

    VectorMap map = VectorMap(layers: [layer]);
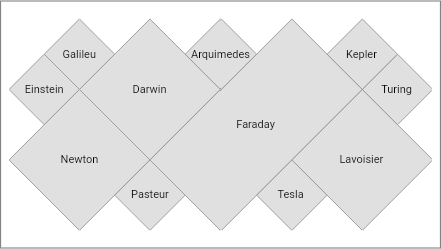
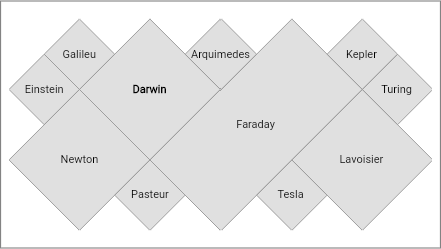
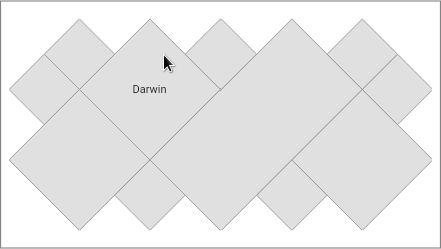
Label visibility #
    MapDataSource polygons =
        await MapDataSource.geoJSON(geojson: polygonsGeoJSON, labelKey: 'Name');
    MapLayer layer = MapLayer(
        dataSource: polygons,
        theme: MapTheme(labelVisibility: (feature) => true));

    VectorMap map = VectorMap(layers: [layer]);
    MapLayer layer = MapLayer(
        dataSource: polygons,
        theme:
            MapTheme(labelVisibility: (feature) => feature.label == 'Darwin'));

    VectorMap map = VectorMap(layers: [layer]);
Label style #
    MapLayer layer = MapLayer(
        dataSource: polygons,
        theme: MapTheme(
            labelVisibility: (feature) => true,
            labelStyleBuilder: (feature, featureColor, labelColor) {
              if (feature.label == 'Darwin') {
                return TextStyle(
                  color: labelColor,
                  fontWeight: FontWeight.bold,
                  fontSize: 11,
                );
              }
              return TextStyle(
                color: labelColor,
                fontSize: 11,
              );
            }));

    VectorMap map = VectorMap(layers: [layer]);
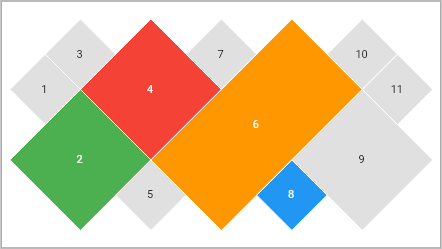
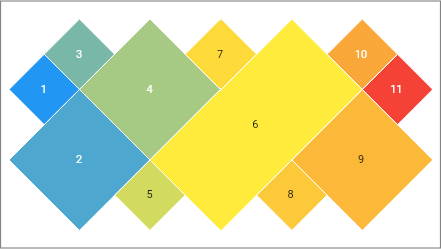
Color by property value #
Sets a color for each property value in GeoJSON. If a color is not set, the default color is used.
Mapping the property key:
    MapDataSource polygons = await MapDataSource.geoJSON(
        geojson: polygonsGeoJSON, keys: ['Seq'], labelKey: 'Seq');
Setting the colors for the property values:
    MapLayer layer = MapLayer(
        dataSource: polygons,
        theme: MapValueTheme(
            contourColor: Colors.white,
            labelVisibility: (feature) => true,
            key: 'Seq',
            colors: {
              2: Colors.green,
              4: Colors.red,
              6: Colors.orange,
              8: Colors.blue
            }));

    VectorMap map = VectorMap(layers: [layer]);
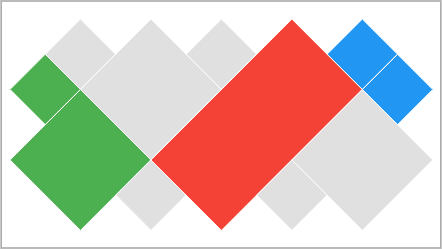
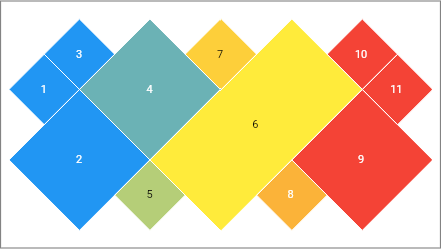
Color by rule #
The feature color is obtained from the first rule that returns a non-null color. If all rules return a null color, the default color is used.
Mapping the property key:
    MapDataSource polygons = await MapDataSource.geoJSON(
        geojson: polygonsGeoJSON, keys: ['Name', 'Seq']);
Setting the rules:
    MapLayer layer = MapLayer(
        dataSource: polygons,
        theme: MapRuleTheme(contourColor: Colors.white, colorRules: [
          (feature) {
            String? value = feature.getValue('Name');
            return value == 'Faraday' ? Colors.red : null;
          },
          (feature) {
            double? value = feature.getDoubleValue('Seq');
            return value != null && value < 3 ? Colors.green : null;
          },
          (feature) {
            double? value = feature.getDoubleValue('Seq');
            return value != null && value > 9 ? Colors.blue : null;
          }
        ]));

    VectorMap map = VectorMap(layers: [layer]);
Gradient #
The gradient is created given the colors and limit values of the chosen property. The property must have numeric values.
Auto min/max values
Uses the min and max values read from data source.
    MapDataSource polygons = await MapDataSource.geoJSON(
        geojson: polygonsGeoJSON, keys: ['Seq'], labelKey: 'Seq');
    MapLayer layer = MapLayer(
        dataSource: polygons,
        theme: MapGradientTheme(
            contourColor: Colors.white,
            labelVisibility: (feature) => true,
            key: 'Seq',
            colors: [Colors.blue, Colors.yellow, Colors.red]));

    VectorMap map = VectorMap(layers: [layer]);
Setting min or max values manually
If the min value is set, all lower values will be displayed using the first gradient color.
If the max value is set, all higher values will be displayed using the last gradient color.
    MapDataSource polygons = await MapDataSource.geoJSON(
        geojson: polygonsGeoJSON, keys: ['Seq'], labelKey: 'Seq');
    MapLayer layer = MapLayer(
        dataSource: polygons,
        theme: MapGradientTheme(
            contourColor: Colors.white,
            labelVisibility: (feature) => true,
            key: 'Seq',
            min: 3,
            max: 9,
            colors: [Colors.blue, Colors.yellow, Colors.red]));

    VectorMap map = VectorMap(layers: [layer]);
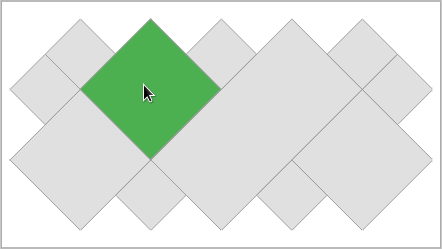
Highlight theme #
Used by addons and cursor hover to highlight layer features on the map.
Color #
    MapLayer layer = MapLayer(
        dataSource: polygons,
        highlightTheme: MapHighlightTheme(color: Colors.green));

    VectorMap map = VectorMap(layers: [layer]);
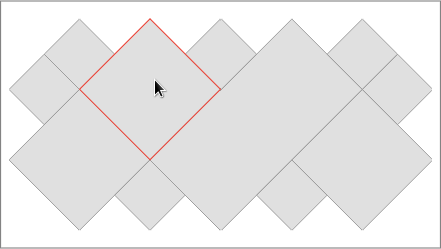
Contour color #
    MapLayer layer = MapLayer(
        dataSource: polygons,
        highlightTheme: MapHighlightTheme(contourColor: Colors.red));

    VectorMap map = VectorMap(layers: [layer]);
Label #
    MapDataSource polygons =
        await MapDataSource.geoJSON(geojson: polygonsGeoJSON, labelKey: 'Name');
    MapLayer layer = MapLayer(
        dataSource: polygons,
        highlightTheme: MapHighlightTheme(labelVisibility: (feature) => true));

    VectorMap map = VectorMap(layers: [layer]);
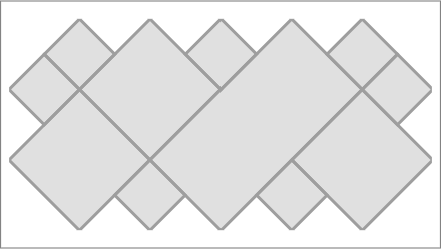
Contour thickness #
    VectorMap map = VectorMap(
        layers: [MapLayer(dataSource: polygons)], contourThickness: 3);
Cursor hover rule #
Enabling hover by property value #
    MapDataSource polygons =
        await MapDataSource.geoJSON(geojson: polygonsGeoJSON, keys: ['Seq']);
    // coloring only the 'Darwin' feature
    MapLayer layer = MapLayer(
        dataSource: polygons,
        theme: MapValueTheme(key: 'Seq', colors: {4: Colors.green}),
        highlightTheme: MapHighlightTheme(color: Colors.green[900]!));

    // enabling hover only for the 'Darwin' feature
    VectorMap map = VectorMap(
        layers: [layer],
        hoverRule: (feature) {
          return feature.getValue('Seq') == 4;
        });
Cursor hover listener #
    MapLayer layer = MapLayer(
        dataSource: polygons,
        highlightTheme: MapHighlightTheme(color: Colors.grey[700]));

    VectorMap map = VectorMap(
        layers: [layer],
        hoverListener: (MapFeature? feature) {
          if (feature != null) {
            int id = feature.id;
            print('Hover - Feature id: $id');
          }
        });
Layers #
Loading multiple data sources:
    MapDataSource polygons =
        await MapDataSource.geoJSON(geojson: polygonsGeoJSON);
    MapDataSource points = await MapDataSource.geoJSON(geojson: pointsGeoJSON);
Creating a map with multiple layers:
    MapHighlightTheme highlightTheme = MapHighlightTheme(color: Colors.green);

    MapLayer polygonsLayer =
        MapLayer(dataSource: polygons, highlightTheme: highlightTheme);
    MapLayer pointsLayer = MapLayer(
        dataSource: points,
        theme: MapTheme(color: Colors.black),
        highlightTheme: highlightTheme);

    VectorMap map = VectorMap(layers: [polygonsLayer, pointsLayer]);
Overlay hover contour #
Allows you to draw the contour over all layers
    MapDataSource dataSource1 = MapDataSource.geometries([
      MapPolygon.coordinates([2, 3, 4, 5, 6, 3, 4, 1, 2, 3])
    ]);
    MapDataSource dataSource2 = MapDataSource.geometries([
      MapPolygon.coordinates([0, 2, 2, 4, 4, 2, 2, 0, 0, 2]),
      MapPolygon.coordinates([4, 2, 6, 4, 8, 2, 6, 0, 4, 2])
    ]);
Overlay disabled:
    MapHighlightTheme highlightTheme =
        MapHighlightTheme(color: Colors.black, contourColor: Colors.black);

    MapLayer layer1 = MapLayer(
        dataSource: dataSource1,
        theme: MapTheme(color: Colors.yellow, contourColor: Colors.black),
        highlightTheme: highlightTheme);
    MapLayer layer2 = MapLayer(
        dataSource: dataSource2,
        theme: MapTheme(color: Colors.green, contourColor: Colors.black),
        highlightTheme: highlightTheme);

    VectorMap map = VectorMap(layers: [layer1, layer2]);

Overlay enabled:
    MapLayer layer1 = MapLayer(
        dataSource: dataSource1,
        theme: MapTheme(color: Colors.yellow, contourColor: Colors.black),
        highlightTheme: MapHighlightTheme(
            color: Colors.black,
            contourColor: Colors.black,
            overlayContour: true));
    MapLayer layer2 = MapLayer(
        dataSource: dataSource2,
        theme: MapTheme(color: Colors.green, contourColor: Colors.black),
        highlightTheme:
            MapHighlightTheme(color: Colors.black, contourColor: Colors.black));

    VectorMap map = VectorMap(layers: [layer1, layer2]);
Marker #
Allows different displays for point geometry.
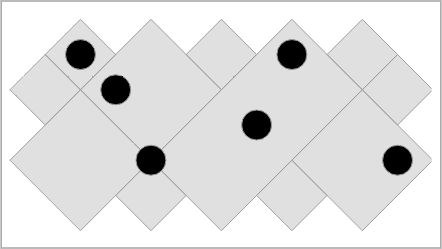
Circle marker #
Default marker.
Fixed radius
Sets a fixed size radius.
    MapDataSource polygons =
        await MapDataSource.geoJSON(geojson: polygonsGeoJSON);
    MapDataSource points =
        await MapDataSource.geoJSON(geojson: pointsGeoJSON, keys: ['AN']);
    MapLayer polygonsLayer = MapLayer(dataSource: polygons);

    MapLayer pointsLayer = MapLayer(
        dataSource: points,
        theme: MapTheme(
            color: Colors.black,
            markerBuilder: CircleMakerBuilder.fixed(radius: 15)));

    VectorMap map = VectorMap(layers: [polygonsLayer, pointsLayer]);
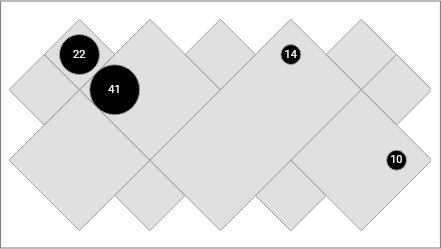
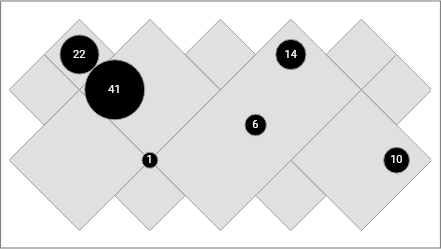
Radius by mapping values
Maps property values to radius values.
    MapDataSource polygons =
        await MapDataSource.geoJSON(geojson: polygonsGeoJSON);
    MapDataSource points = await MapDataSource.geoJSON(
        geojson: pointsGeoJSON, keys: ['AN'], labelKey: 'AN');
    MapLayer polygonsLayer = MapLayer(dataSource: polygons);

    MapLayer pointsLayer = MapLayer(
        dataSource: points,
        theme: MapTheme(
            color: Colors.black,
            labelVisibility: (feature) => true,
            markerBuilder: CircleMakerBuilder.map(
                key: 'AN', radiuses: {41: 25, 22: 20, 14: 10, 10: 10})));

    VectorMap map = VectorMap(layers: [polygonsLayer, pointsLayer]);
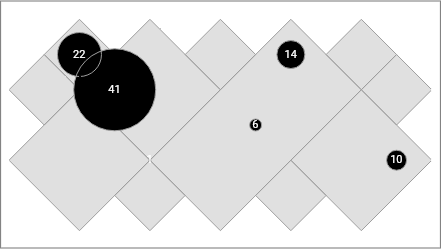
Radius by property values
Uses the property values as radius values.
    MapDataSource polygons =
        await MapDataSource.geoJSON(geojson: polygonsGeoJSON);
    MapDataSource points = await MapDataSource.geoJSON(
        geojson: pointsGeoJSON, keys: ['AN'], labelKey: 'AN');
    MapLayer polygonsLayer = MapLayer(dataSource: polygons);

    MapLayer pointsLayer = MapLayer(
        dataSource: points,
        theme: MapTheme(
            color: Colors.black,
            labelVisibility: (feature) => true,
            markerBuilder: CircleMakerBuilder.property(key: 'AN')));

    VectorMap map = VectorMap(layers: [polygonsLayer, pointsLayer]);
Radius in proportion to property values
    MapDataSource polygons =
        await MapDataSource.geoJSON(geojson: polygonsGeoJSON);
    MapDataSource points = await MapDataSource.geoJSON(
        geojson: pointsGeoJSON, keys: ['AN'], labelKey: 'AN');
    MapLayer polygonsLayer = MapLayer(dataSource: polygons);

    MapLayer pointsLayer = MapLayer(
        dataSource: points,
        theme: MapTheme(
            color: Colors.black,
            labelVisibility: (feature) => true,
            markerBuilder: CircleMakerBuilder.proportion(
                key: 'AN', minRadius: 8, maxRadius: 30)));

    VectorMap map = VectorMap(layers: [polygonsLayer, pointsLayer]);
Addons #
Allows to add components on the map.
Legend #
Available customizations:
- padding
- margin
- decoration
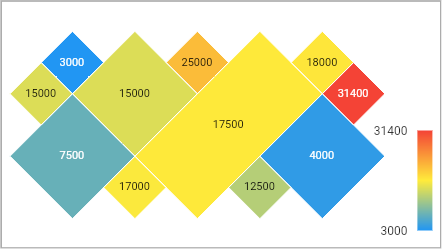
Gradient legend
Legend for gradient themes.
    MapDataSource polygons = await MapDataSource.geoJSON(
        geojson: polygonsGeoJSON, keys: ['Seq'], labelKey: 'Seq');
    MapLayer layer = MapLayer(
        dataSource: polygons,
        theme: MapGradientTheme(
            contourColor: Colors.white,
            labelVisibility: (feature) => true,
            key: 'Gts',
            colors: [Colors.blue, Colors.yellow, Colors.red]));

    VectorMap map = VectorMap(
        layersPadding: EdgeInsets.fromLTRB(8, 8, 56, 8),
        layers: [layer],
        addons: [GradientLegend(layer: layer)]);
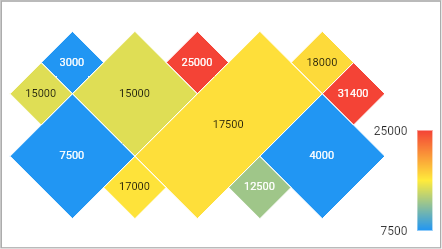
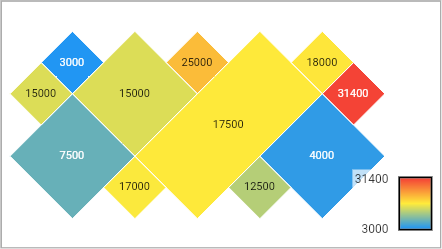
Gradient legend - Setting min and max values
    MapLayer layer = MapLayer(
        dataSource: polygons,
        theme: MapGradientTheme(
            contourColor: Colors.white,
            labelVisibility: (feature) => true,
            key: 'Gts',
            min: 7500,
            max: 25000,
            colors: [Colors.blue, Colors.yellow, Colors.red]));

    VectorMap map = VectorMap(
        layersPadding: EdgeInsets.fromLTRB(8, 8, 56, 8),
        layers: [layer],
        addons: [GradientLegend(layer: layer)]);
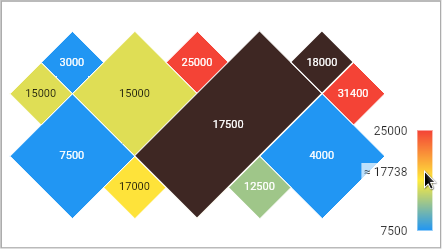
Gradient legend - Highlight
    MapDataSource polygons = await MapDataSource.geoJSON(
        geojson: polygonsGeoJSON, keys: ['Seq'], labelKey: 'Seq');
    MapLayer layer = MapLayer(
        dataSource: polygons,
        theme: MapGradientTheme(
            contourColor: Colors.white,
            labelVisibility: (feature) => true,
            key: 'Gts',
            min: 7500,
            max: 25000,
            colors: [Colors.blue, Colors.yellow, Colors.red]),
        highlightTheme: MapHighlightTheme(color: Colors.brown[900]));

    VectorMap map = VectorMap(
        layersPadding: EdgeInsets.fromLTRB(8, 8, 56, 8),
        layers: [layer],
        addons: [GradientLegend(layer: layer)]);
Gradient legend - Customization
Available customizations:
- gradient bar width
- gradient bar height
- gradient bar border
- values font size
- gap between bar and values
    MapDataSource polygons = await MapDataSource.geoJSON(
        geojson: polygonsGeoJSON, keys: ['Seq'], labelKey: 'Seq');
    MapLayer layer = MapLayer(
        dataSource: polygons,
        theme: MapGradientTheme(
            contourColor: Colors.white,
            labelVisibility: (feature) => true,
            key: 'Gts',
            colors: [Colors.blue, Colors.yellow, Colors.red]));

    VectorMap map =
        VectorMap(layersPadding: EdgeInsets.fromLTRB(8, 8, 56, 8), layers: [
      layer
    ], addons: [
      GradientLegend(
          layer: layer,
          barBorder: Border.all(width: 2),
          barHeight: 50,
          barWidth: 30)
    ]);
Click listener #
    MapLayer layer = MapLayer(
        dataSource: polygons,
        highlightTheme: MapHighlightTheme(color: Colors.grey[800]!));

    VectorMap map = VectorMap(
        layers: [layer],
        clickListener: (feature) {
          print(feature.id);
        });
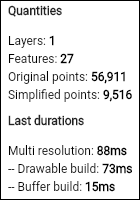
Debugger #
Building a debugger
MapDebugger debugger = MapDebugger();
Binding the debugger on the map
VectorMap map = VectorMap(debugger: debugger, layers: [layer]);
Building the debugger widget
MapDebuggerWidget debuggerWidget = MapDebuggerWidget(debugger);
Agenda for the next few days #
- More theming features
- Zoom / Pan
- More legends
- More gradient legend customizations
- More addons
- Release the final version (1.0.0). The API may have some small changes.
Metadata
Publisher
Metadata
Vector map for Flutter. Highly customizable. Compatible with GeoJSON. Map chart. Pure Flutter.
Repository (GitHub)
View/report issues
License
![]() unknown (LICENSE)
unknown (LICENSE)