smart_hbar_chart 1.0.4  smart_hbar_chart: ^1.0.4 copied to clipboard
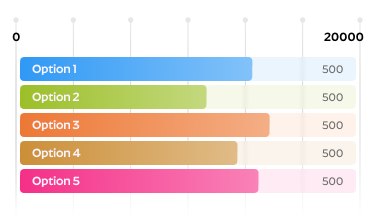
A customizable horizontal bar chart for Flutter, supporting animations, images, and gradients.
Smart Horizontal Bar Chart #
A customizable horizontal bar chart for Flutter, supporting animations, images, and gradients.

Features #
✔️ Animated horizontal bars
✔️ Supports images/icons in bars
✔️ Customizable colors, gradients, and styles
✔️ Easy-to-use API
Installation #
Add this to your pubspec.yaml:
      dependencies:
        smart_hbar_chart: ^1.0.4
Then run:
flutter pub get
Usage #
Step 1: Import the package #
To use the SmartBarGraph widget in your Flutter app, follow these steps:
import 'package:smart_hbar_chart/smart_hbar_chart.dart';
Step 2: Prepare your data #
Create a list of SmartBarData objects. Each object will contain the data for one bar in the chart, including the label, value, and image URL.
List<SmartBarData> data = [
SmartBarData(label: 'Item 1', value: 40, imageUrl: 'https://example.com/image1.jpg'),
SmartBarData(label: 'Item 2', value: 60, imageUrl: 'https://example.com/image2.jpg'),
SmartBarData(label: 'Item 3', value: 80, imageUrl: 'https://example.com/image3.jpg'),
];
Step 3: Use the SmartBarGraph widget #
Now, use the SmartBarGraph widget in your app. You can specify the data, maximum value, and styling options.
SmartBarGraph(
data: data,
maxValue: 100,
style: SmartBarStyle(
barHeight: 30,
barBorderRadius: 8,
backgroundColor: Colors.grey.shade300,
barGradientColors: [Colors.blue, Colors.green],
labelTextStyle: TextStyle(color: Colors.black, fontSize: 14),
valueTextStyle: TextStyle(color: Colors.black, fontSize: 12),
animationDuration: Duration(seconds: 2),
),
imageBuilder: (imageUrl) => ClipRRect(
borderRadius: BorderRadius.circular(8),
child: Image.network(imageUrl, height: 24, width: 24, fit: BoxFit.cover),
),
)
Step 4: Customize the style (optional) #
You can customize the appearance of the bars by passing a SmartBarStyle object. This allows you to adjust the bar height, border radius, gradient colors, animation duration, and text styles.
    SmartBarStyle(
barHeight: 30,
barBorderRadius: 8,
backgroundColor: Colors.grey.shade300,
barGradientColors: [Colors.blue, Colors.green],
labelTextStyle: TextStyle(color: Colors.black, fontSize: 14),
valueTextStyle: TextStyle(color: Colors.black, fontSize: 12),
animationDuration: Duration(seconds: 2),
);
Step 5: Result #
The result will display a horizontal bar chart where each bar represents an item, with an animated filling, image/icon, and a label.