phasor_diagram 0.0.1+6  phasor_diagram: ^0.0.1+6 copied to clipboard
Flutter package that provides a customizable solution for visualizing phasor diagrams in a three-phase electrical system
Paints a phasor diagram for a three-phase electrical system.
Description #
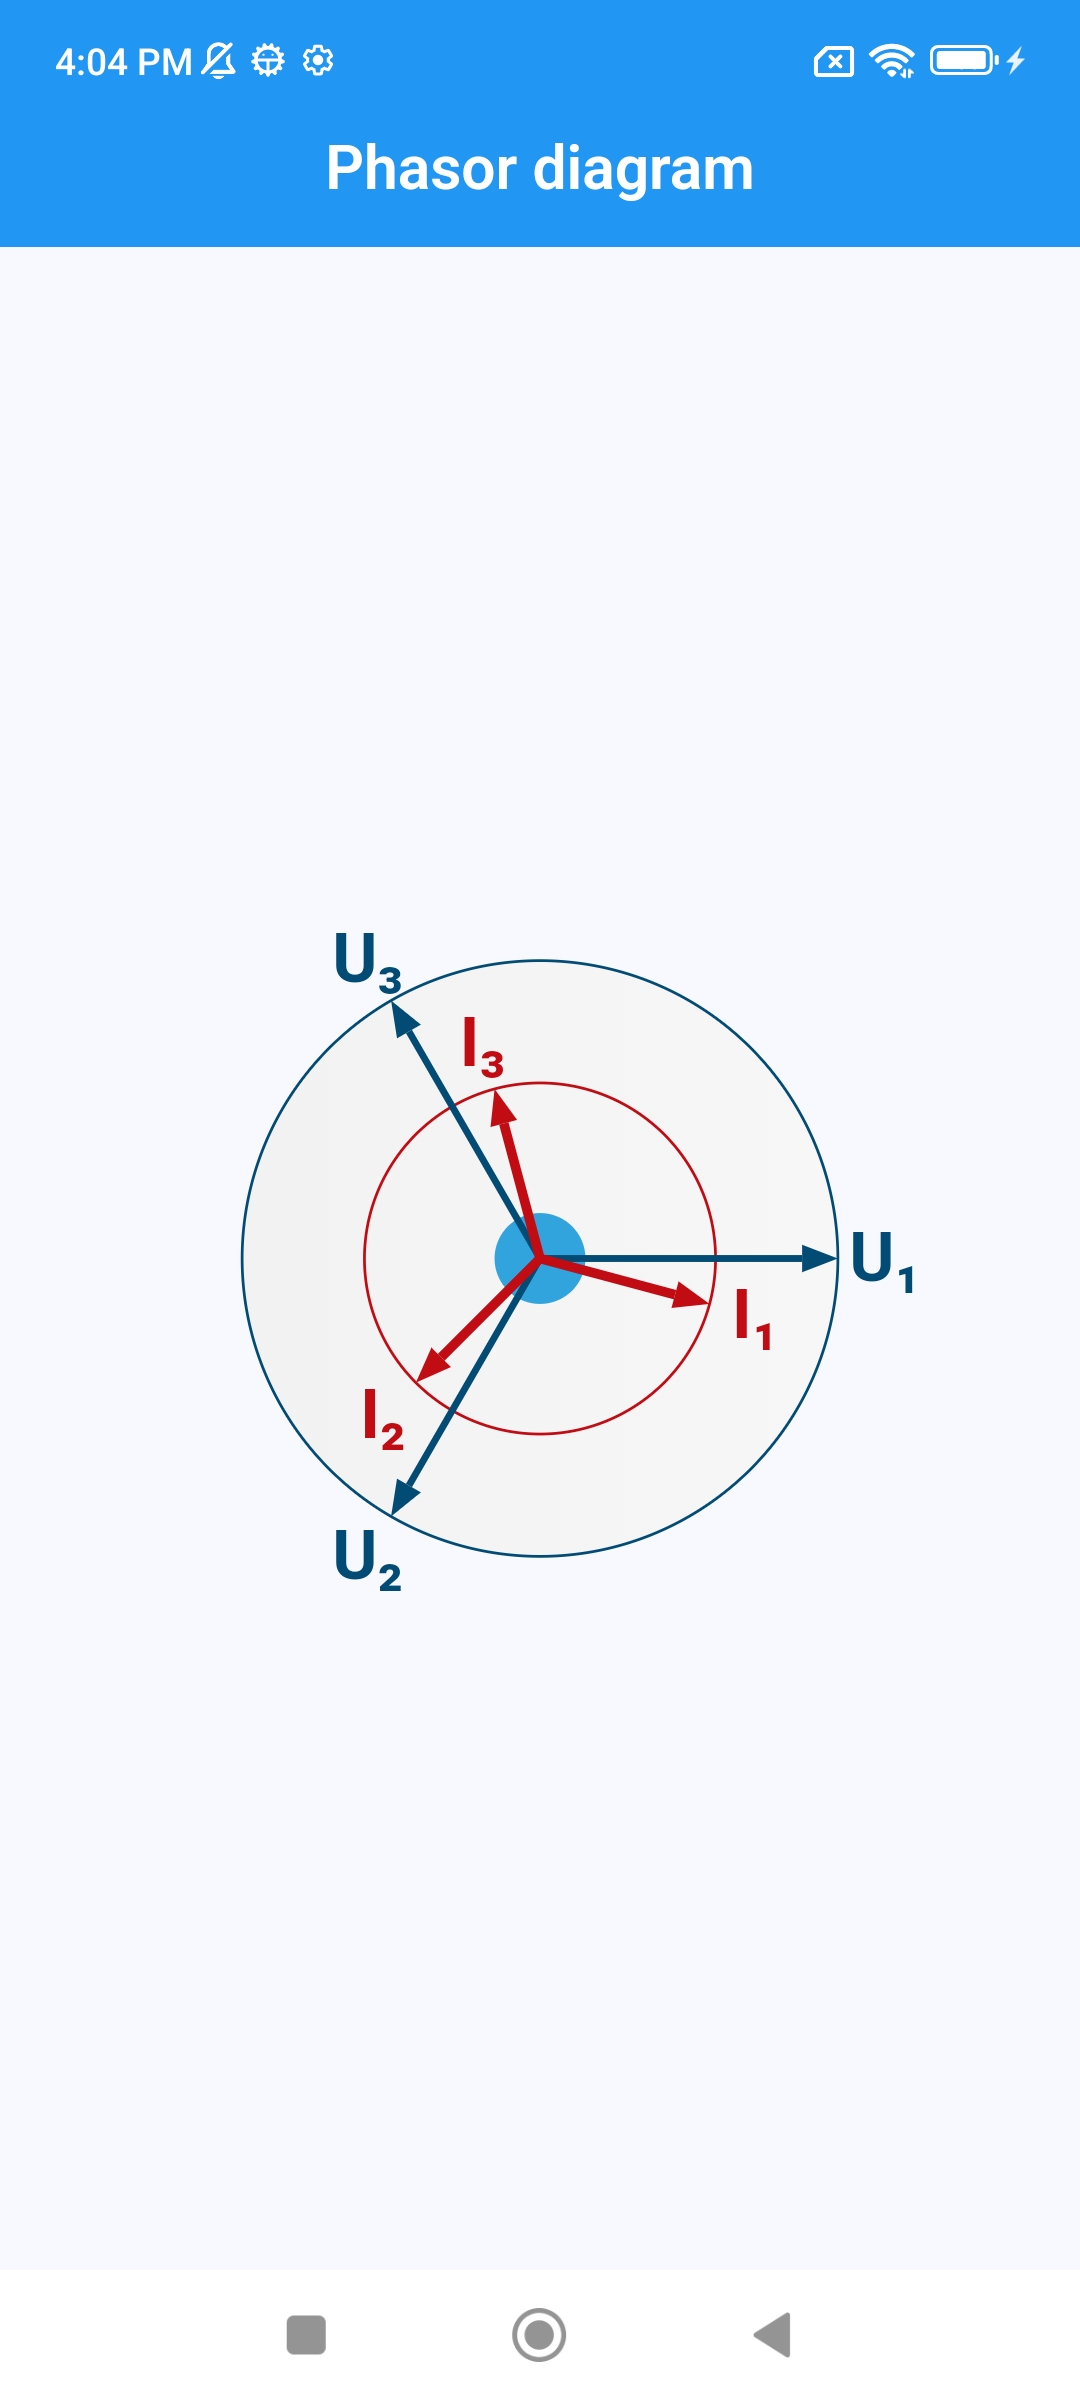
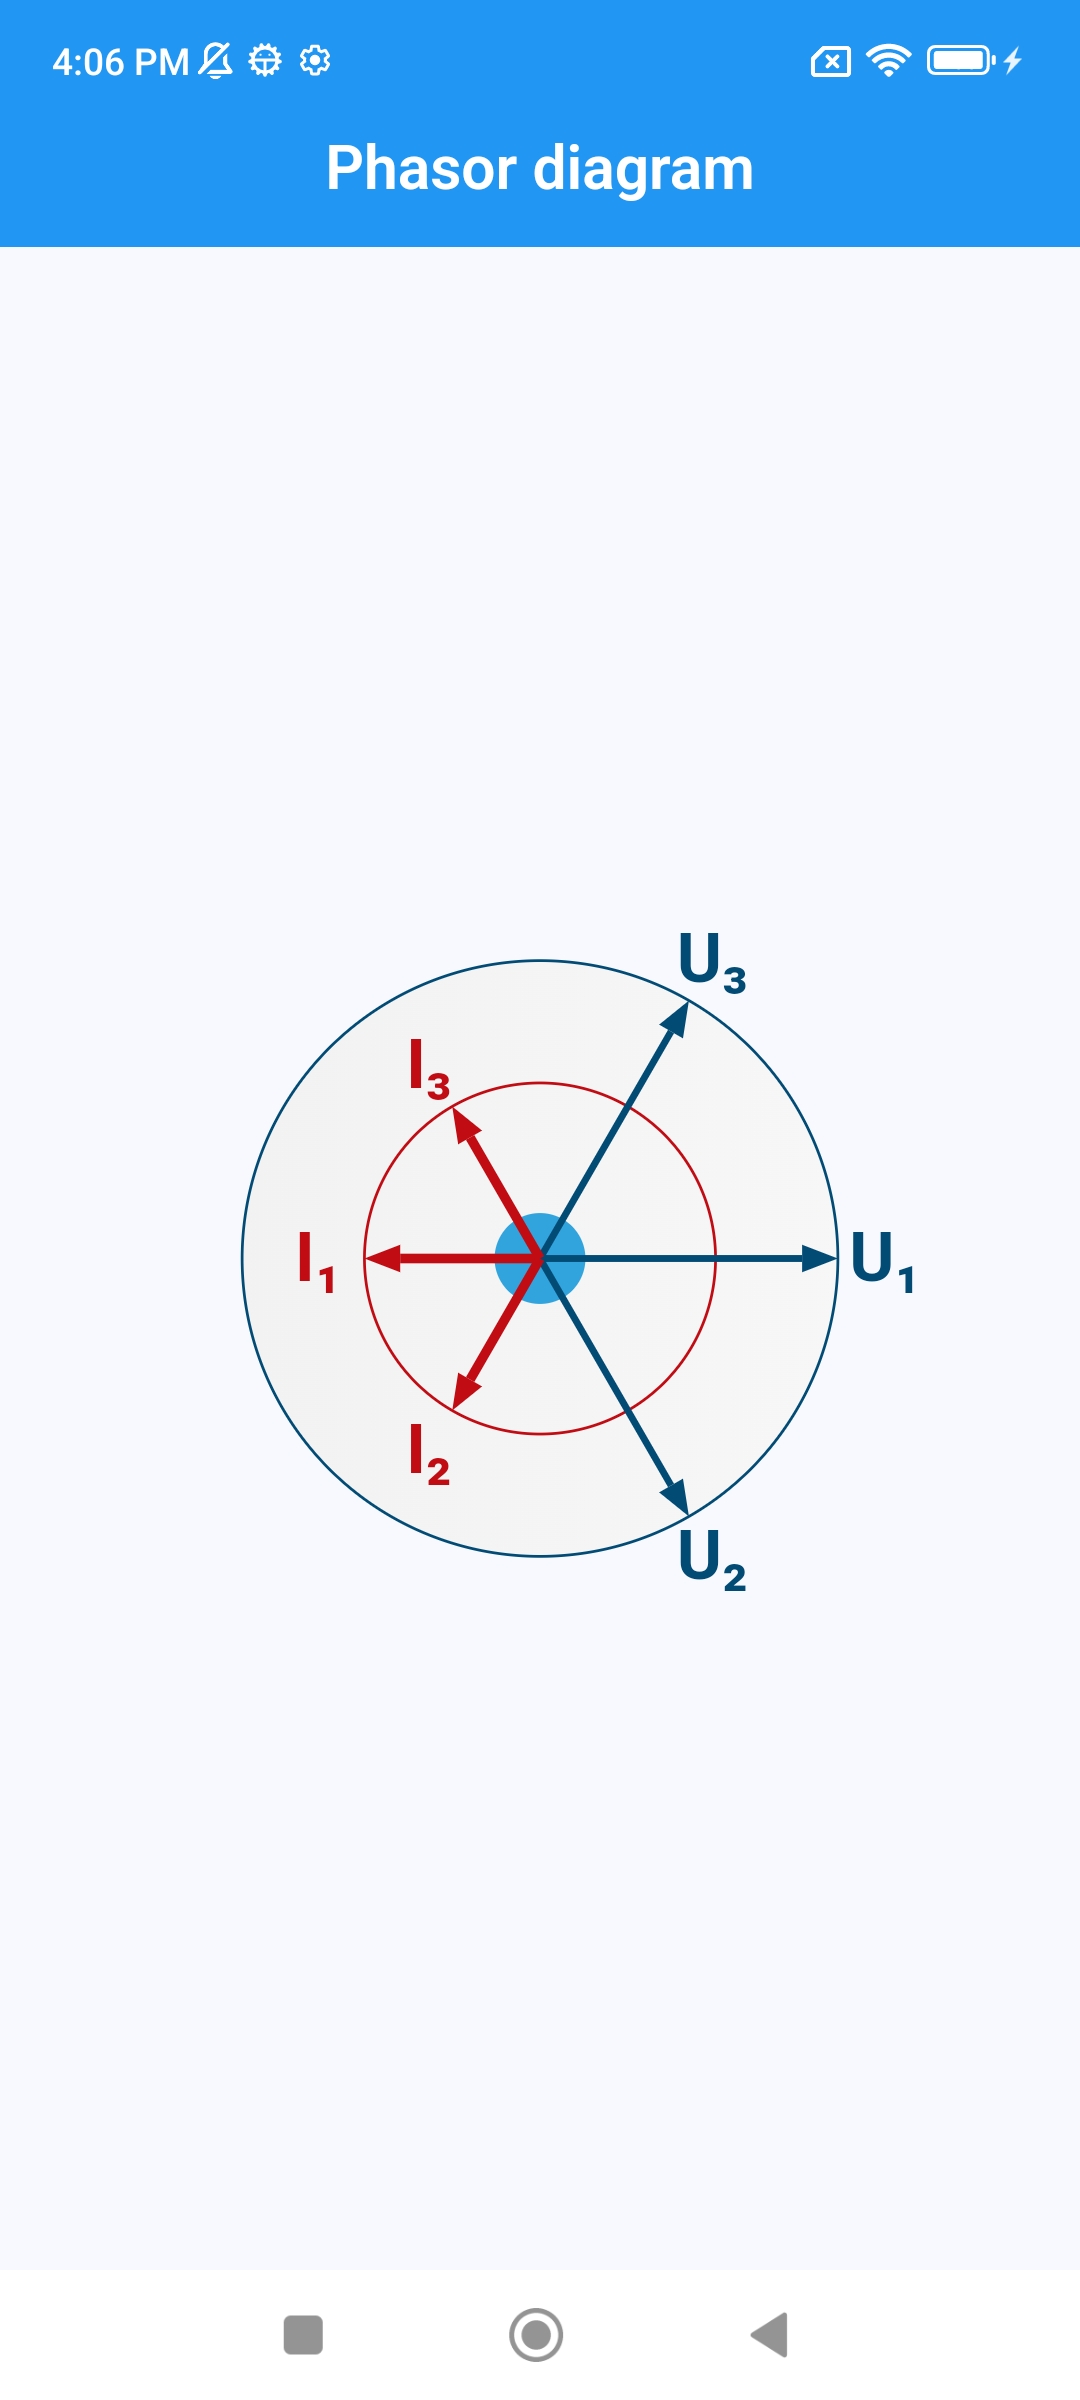
The phasor diagram is a graphical representation used in electrical engineering to illustrate the relationships between voltages and currents in a three-phase system. It consists of three voltage vectors (represented as U) and three current vectors (represented as I) for each phase.
In the PhasorDiagram, both current and voltage are represented as vectors. Each vector is depicted as a line with an arrow at one end.
- The length of the vector represents its intensity.
- The angle of the vector indicates its direction relative to an imaginary x-axis.
- Voltage vectors are represented in blue, while current vectors are represented in red.


Usage #
All properties are required. The size must be greater than or equal to 100.0, and the rest of the properties cannot have negative values.
PhasorDiagram(
  size: 250.0,
  phaseOneVoltageValue: 220.0,
  phaseOneVoltageAngle: 0.0,
  phaseTwoVoltageValue: 220.0,
  phaseTwoVoltageAngle: 120.0,
  phaseThreeVoltageValue: 220.0,
  phaseThreeVoltageAngle: 240.0,
  phaseOneCurrentValue: 1.1,
  phaseOneCurrentAngle: 15.0,
  phaseTwoCurrentValue: 1.1,
  phaseTwoCurrentAngle: 135.0,
  phaseThreeCurrentValue: 1.1,
  phaseThreeCurrentAngle: 255.0,
)