nrb 3.0.1  nrb: ^3.0.1 copied to clipboard
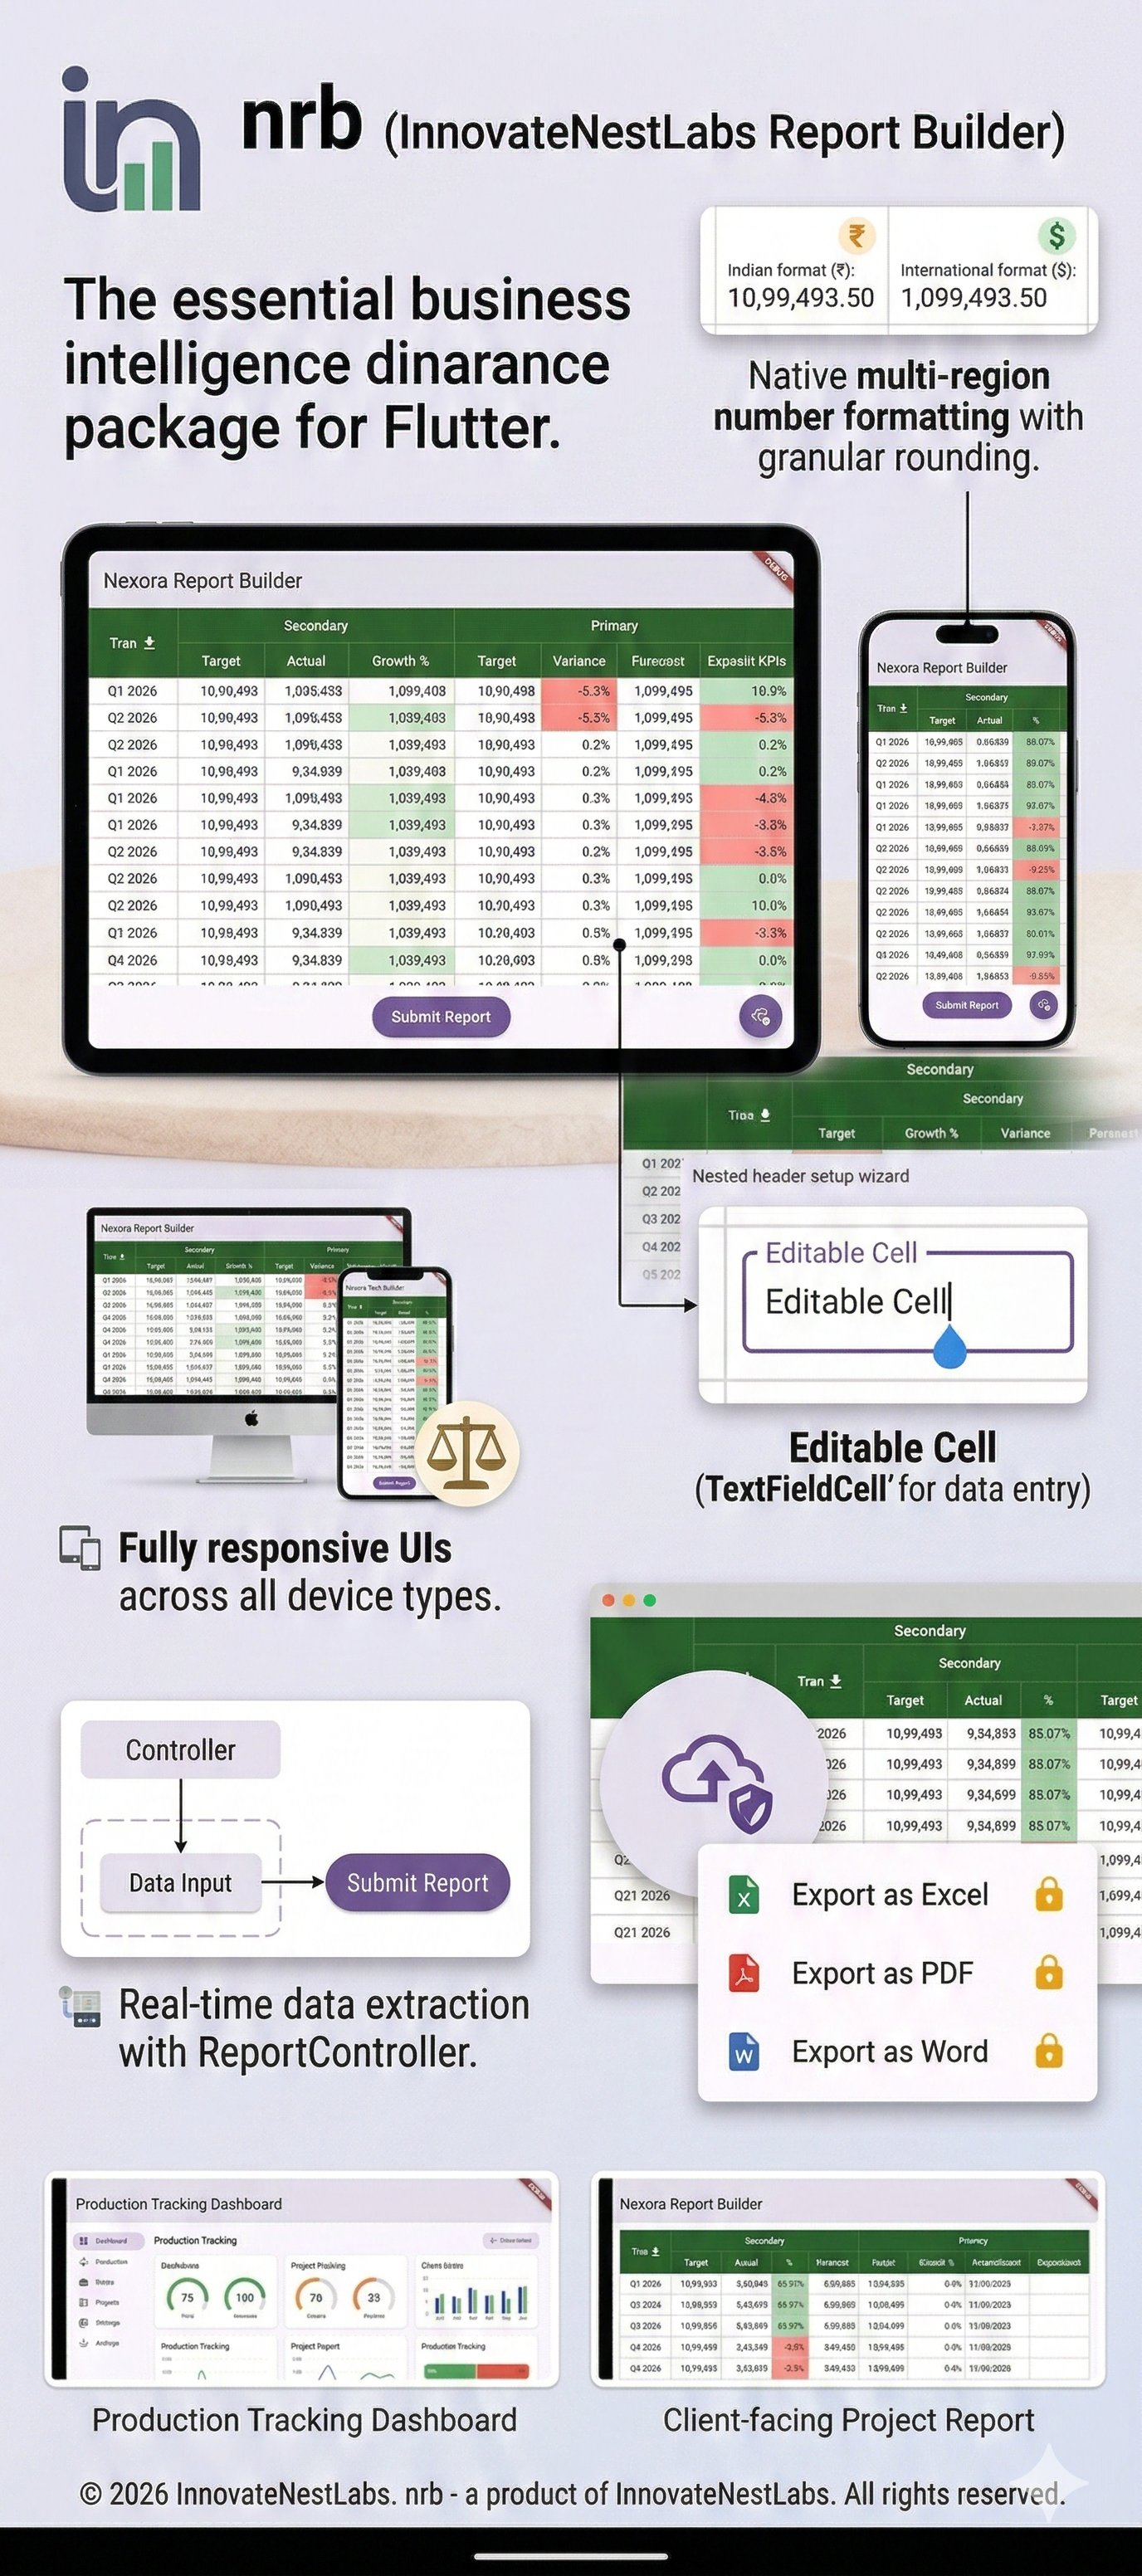
A highly responsive Flutter table and report builder for complex nested headers, editable data grids, and premium Excel/PDF exports.
📊 nrb (Nexora Report Builder) #
A customizable and highly responsive Flutter table widget builder designed for complex, nested headers and dynamic data visualization. Ideal for enterprise dashboards, inventory tracking, financial reports, or structured data-entry UIs.
📸 Demo Showcase #
📊 Comprehensive Tables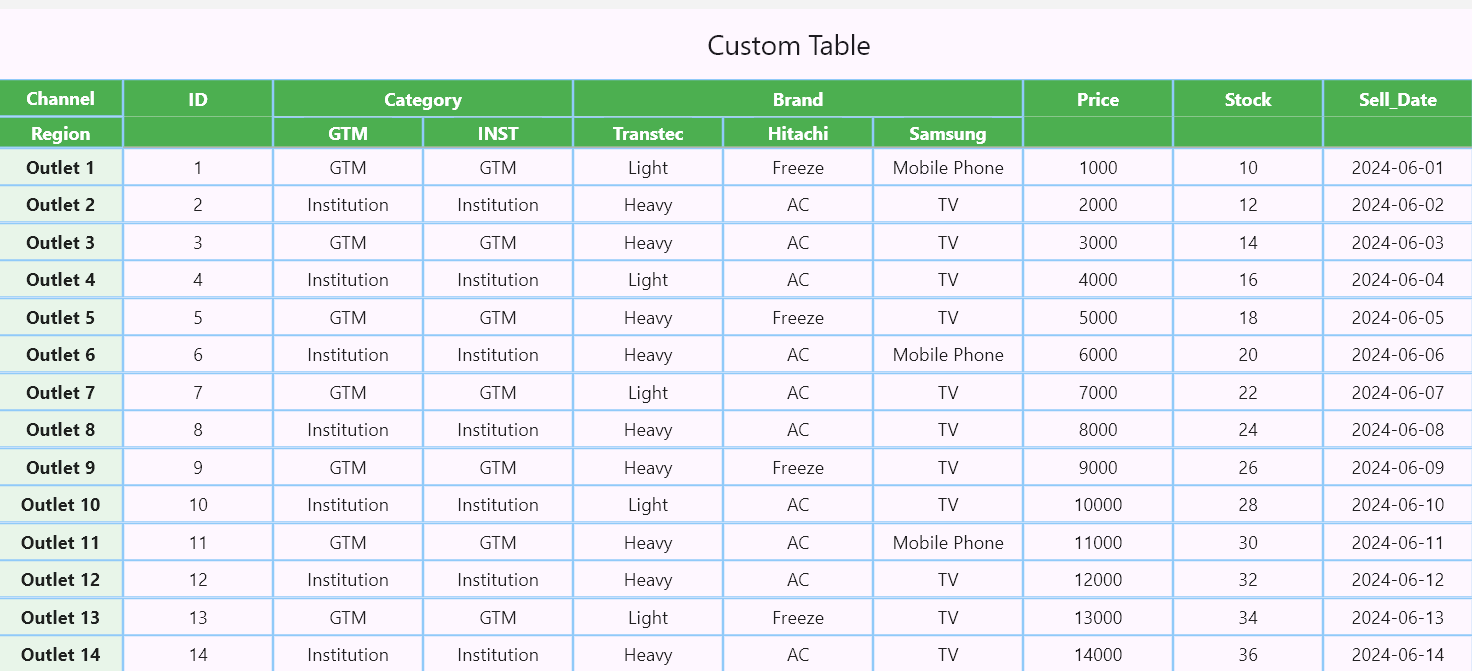
|
📈 Interactive Dashboards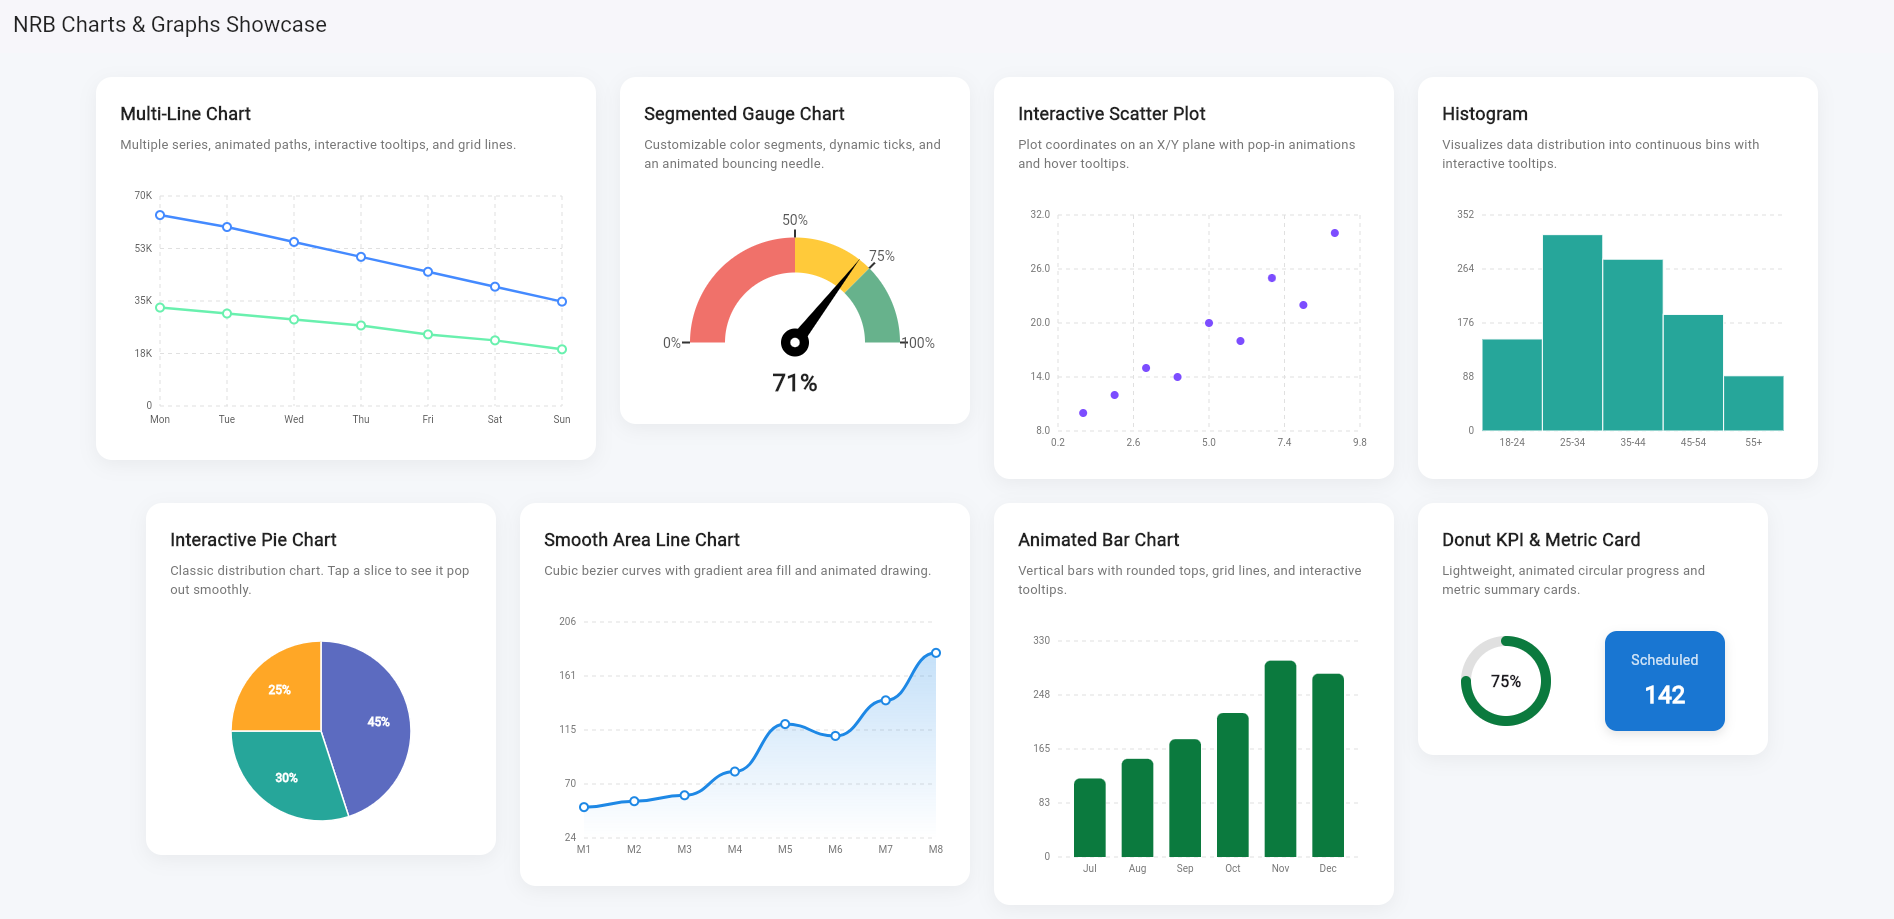
|
📺 Demos #
Live Interaction
|
Premium Export
|
📥 Export to PDF: Download a Sample Export here
✨ Features #
- 📱 Fully Responsive: Columns auto-measure their content (
wrap_content) and expand proportionally to fill available screen space. - 📌 Complex Nested Headers: Build main headers, sub-headers, and sticky left-side columns (like Excel-style freeze panes).
- ✍️ Editable Data Grids: Mix static
TextCells with interactiveTextFieldCells to turn your report into a scrollable data-entry form. - 🔄 Real-time Data Extraction: Use
ReportControllerto extract all grid data instantly via a Submit action. - 💰 Advanced Number Formatting: Built-in
NRBNumberFormatterhandles International and Indian comma separation, along with granular rounding rules. - 📏 Resizable Columns: Double-click column edges to auto-fit, or drag to manually resize.
- 📥 Premium Export & Share: Instantly download tables to Excel, PDF, or Word, or share them directly via native device dialogs (Requires an active subscription bound to your App's Package Name).
🚀 Getting Started #
To integrate nrb into your Flutter project:
1. Add dependency #
dependencies:
  nrb: ^[latest_version]
2. Prepare main to include the report layout #
import 'dart:io' show Directory, File, Platform;

import 'package:flutter/foundation.dart' show kIsWeb, kDebugMode;
import 'package:flutter/material.dart';
import 'package:nrb/nrb.dart';
import 'package:permission_handler/permission_handler.dart';
import 'package:device_info_plus/device_info_plus.dart';

void main() {
  runApp(
    MaterialApp(
      debugShowCheckedModeBanner: false,
      home: InnovateNestReportScreen(),
    ),
  );
}

class InnovateNestReportScreen extends StatelessWidget {
  InnovateNestReportScreen({super.key});

  final _headers = [
    HeaderCell(
      text: "Financials (USD)",
      span: 3,
      backgroundColor: const Color(0xFF0B7A3E), // Brand Accent
    ),
    HeaderCell(
      text: "Operations",
      span: 2,
      backgroundColor: const Color(0xFF0B7A3E),
    ),
  ];

  final _subHeaders = [
    SubHeaderCell(text: "Gross Rev.", backgroundColor: const Color(0xFF0B7A3E), foregroundColor: Colors.white,),
    SubHeaderCell(text: "Op. Expenses", backgroundColor: const Color(0xFF0B7A3E), foregroundColor: Colors.white,),
    SubHeaderCell(text: "Net Profit", backgroundColor: const Color(0xFF0B7A3E), foregroundColor: Colors.white,),
    SubHeaderCell(text: "Active Clients", backgroundColor: const Color(0xFF0B7A3E), foregroundColor: Colors.white,),
    SubHeaderCell(text: "SLA Uptime", backgroundColor: const Color(0xFF0B7A3E), foregroundColor: Colors.white,),
  ];

  final _leftColumns = [
    TextCell(
      itemContent: "Custom Web Applications",
      textAlignment: Alignment.centerLeft,
    ),
    TextCell(
      itemContent: "Mobile App Development",
      textAlignment: Alignment.centerLeft,
    ),
    TextCell(
      itemContent: "Enterprise ERP Solutions",
      textAlignment: Alignment.centerLeft,
    ),
    TextCell(
      itemContent: "Cloud Hosting & DevOps",
      textAlignment: Alignment.centerLeft,
    ),
    TextCell(
      itemContent: "AI & Machine Learning",
      textAlignment: Alignment.centerLeft,
    ),
    TextCell(
      itemContent: "UI/UX Design Services",
      textAlignment: Alignment.centerLeft,
    ),
    TextCell(
      itemContent: "E-Commerce Platforms",
      textAlignment: Alignment.centerLeft,
    ),
    TextCell(
      itemContent: "API Development",
      textAlignment: Alignment.centerLeft,
    ),
    TextCell(
      itemContent: "Cybersecurity Audits",
      textAlignment: Alignment.centerLeft,
    ),
    TextCell(
      itemContent: "Data Analytics & BI",
      textAlignment: Alignment.centerLeft,
    ),
    TextCell(itemContent: "IT Consulting", textAlignment: Alignment.centerLeft),
    TextCell(
      itemContent: "Maintenance & Support",
      textAlignment: Alignment.centerLeft,
    ),
  ];

  final _tableData = [
    // Web Apps
    [
      TextCell(itemContent: "450,000", isAmount: true),
      TextCell(itemContent: "180,000", isAmount: true),
      TextCell(itemContent: "270,000", isAmount: true),
      TextCell(itemContent: "42"),
      TextCell(itemContent: "99.9%"),
    ],
    // Mobile Apps
    [
      TextCell(itemContent: "385,500", isAmount: true),
      TextCell(itemContent: "155,000", isAmount: true),
      TextCell(itemContent: "230,500", isAmount: true),
      TextCell(itemContent: "28"),
      TextCell(itemContent: "99.8%"),
    ],
    // ERP
    [
      TextCell(itemContent: "850,000", isAmount: true),
      TextCell(itemContent: "320,000", isAmount: true),
      TextCell(itemContent: "530,000", isAmount: true),
      TextCell(itemContent: "8"),
      TextCell(itemContent: "99.99%"),
    ],
    // Cloud
    [
      TextCell(itemContent: "210,000", isAmount: true),
      TextCell(itemContent: "95,000", isAmount: true),
      TextCell(itemContent: "115,000", isAmount: true),
      TextCell(itemContent: "115"),
      TextCell(itemContent: "99.99%"),
    ],
    // AI & ML
    [
      TextCell(itemContent: "540,200", isAmount: true),
      TextCell(itemContent: "210,000", isAmount: true),
      TextCell(itemContent: "330,200", isAmount: true),
      TextCell(itemContent: "14"),
      TextCell(itemContent: "99.5%"),
    ],
    // UI/UX
    [
      TextCell(itemContent: "125,000", isAmount: true),
      TextCell(itemContent: "45,000", isAmount: true),
      TextCell(itemContent: "80,000", isAmount: true),
      TextCell(itemContent: "55"),
      TextCell(itemContent: "N/A"),
    ],
    // E-Commerce
    [
      TextCell(itemContent: "310,000", isAmount: true),
      TextCell(itemContent: "110,000", isAmount: true),
      TextCell(itemContent: "200,000", isAmount: true),
      TextCell(itemContent: "34"),
      TextCell(itemContent: "99.9%"),
    ],
    // API Dev
    [
      TextCell(itemContent: "195,000", isAmount: true),
      TextCell(itemContent: "65,000", isAmount: true),
      TextCell(itemContent: "130,000", isAmount: true),
      TextCell(itemContent: "22"),
      TextCell(itemContent: "99.95%"),
    ],
    // Cybersec
    [
      TextCell(itemContent: "280,000", isAmount: true),
      TextCell(itemContent: "90,000", isAmount: true),
      TextCell(itemContent: "190,000", isAmount: true),
      TextCell(itemContent: "19"),
      TextCell(itemContent: "100%"),
    ],
    // Data Analytics
    [
      TextCell(itemContent: "415,000", isAmount: true),
      TextCell(itemContent: "140,000", isAmount: true),
      TextCell(itemContent: "275,000", isAmount: true),
      TextCell(itemContent: "26"),
      TextCell(itemContent: "99.8%"),
    ],
    // IT Consulting
    [
      TextCell(itemContent: "150,000", isAmount: true),
      TextCell(itemContent: "30,000", isAmount: true),
      TextCell(itemContent: "120,000", isAmount: true),
      TextCell(itemContent: "45"),
      TextCell(itemContent: "N/A"),
    ],
    // Maintenance
    [
      TextCell(itemContent: "290,000", isAmount: true),
      TextCell(itemContent: "85,000", isAmount: true),
      TextCell(itemContent: "205,000", isAmount: true),
      TextCell(itemContent: "88"),
      TextCell(itemContent: "99.9%"),
    ],
  ];

  @override
  Widget build(BuildContext context) {
    return Scaffold(
      appBar: AppBar(
        title: const Text('Innovate Nest Labs - Financial Report Q4'),
        backgroundColor: Colors.white,
        foregroundColor: Colors.black87,
        elevation: 2,
      ),
      body: ReportMaker(
        // --- REPORT STRUCTURE ---
        // --- 1. HEADERS ---
        headers: _headers,

        // --- 2. SUB-HEADERS ---
        subHeaders: _subHeaders,

        // --- 3. LEFT STICKY COLUMNS ---
        leftColumn: _leftColumns,

        // --- 4. TABLE DATA ---
        tableData: _tableData,

        // --- LEFT top ---
        stickyHeaderLabel: "Service / Division",
        stickyHeaderBackgroundColor: const Color(0xFF0B7A3E), // Brand Accent
        // Brand Accent
        stickyHeaderForegroundColor: Colors.white,

        // --- FOR DOWNLOAD FEATURES ---
        packageName: "com.innovatenestlabs.demoapp", // For free demo
        apiKey: "", // Empty for free demo
        enableDownload: true,
        showDownloadFloatingButton: true,
        reportName: "Financial Report Q4",
        // --- 5. PERMISSION HANDLING & DOWNLOAD LOGIC ---
        // Update your onDownloadCompleted logic:
        onDownloadCompleted: (bytes, fileName) async {
          if (!kIsWeb) {
            bool hasPermission = false;

            if (Platform.isAndroid) {
              final deviceInfo = DeviceInfoPlugin();
              final androidInfo = await deviceInfo.androidInfo;

              if (androidInfo.version.sdkInt >= 33) {
                // On Android 13+, we don't need 'storage' permission to write to Downloads
                // We just need to ensure we have 'photos' if we were reading,
                // but for writing, we can often just proceed.
                hasPermission = true;
              } else {
                // For Android 12 and below
                var status = await Permission.storage.status;
                if (!status.isGranted) {
                  status = await Permission.storage.request();
                }
                hasPermission = status.isGranted;
              }
            }

            if (hasPermission) {
              try {
                // Use path_provider for better reliability
                // For now, continuing with your path:
                final directory = Directory('/storage/emulated/0/Download');
                if (!await directory.exists()) {
                  await directory.create(recursive: true);
                }

                final file = File('${directory.path}/$fileName');
                await file.writeAsBytes(bytes);

                if (context.mounted) {
                  ScaffoldMessenger.of(context).showSnackBar(
                    SnackBar(content: Text('Report saved to Downloads'), backgroundColor: Colors.green),
                  );
                }
              } catch (e) {
                if (context.mounted) {
                  ScaffoldMessenger.of(context).showSnackBar(
                    SnackBar(content: Text('Save failed: $e'), backgroundColor: Colors.red),
                  );
                }
              }
            } else {
              // Handle denied state
            }
          }
        },
      ),
    );
  }
}
💡 Note on Premium Exporting (Test it for free!) #
Want to test the export and sharing capabilities before purchasing a subscription? You can use our live demo credentials!
To successfully trigger the Download and Share features, you MUST pass the following three parameters to ReportMaker:
enableDownload: true(Master switch to activate the export features)packageName: "com.innovatenestlabs.demoapp"(Use this exact demo package name to test)apiKey: ""(Pass the demo API key as blank string)
⚠️ Free Tier Limits: The demo package name operates on a free testing tier, which is strictly limited to 10 API hit requests per day (equivalent to 5 successful file exports). If you exceed this limit, the export network requests will be temporarily blocked until the daily quota resets.
🧮 Number Formatting #
nrb comes with a powerful formatter built directly into TextCell. Simply flag the cell as an amount and choose your style:
TextCell(
  itemContent: "1099493.5",
  isAmount: true, // Automatically applies commas
  numberFormatType: CellNumberFormat.indian, // Formats as 10,99,493.5
  roundMode: RoundMode.withRoundUp,
  roundTo: 2, // Formats as 10,99,493.50
  textAlignment: Alignment.centerRight,
)
Want to directly use on any part? Just follow the syntax below:
NRBNumberFormatter.format(yourAmountValue, style: NumberStyle.indian, roundTo: 2)
📥 Premium Export & Share Features (Subscription) #
nrb supports backend-driven exporting of your perfectly formatted grids to Excel (.xlsx), PDF, and Word, complete with an interactive floating action menu for downloading and sharing.
To enable the interactive download and share buttons in the UI:
- Set
enableDownload: trueandshowDownloadFloatingButton: trueinReportMaker. - Crucial: Provide your app's exact
packageName. This package name must be registered and hold an active premium subscription. - Use the interactive FAB to either Download the file directly or Share it instantly via your device's native sharing dialog (e.g., email, messaging apps).
- Handle the incoming bytes using the
onDownloadCompletedcallback if you need custom save logic.
👑 Get Premium: Access to the official Nexora API for file generation and sharing requires an active premium subscription tied to your application's package name.
📊 Beautiful Native Charts & Graphs #
nrb comes packed with a suite of enterprise-grade, highly customizable charts and graphs. No need to bloat your app with heavy third-party charting libraries—everything you need for a stunning analytics dashboard is built right in. All charts feature smooth, physics-based animations out of the box.
Multi-Line Chart (Averages & Trends) #
Plot multiple data series on a single responsive grid with interactive touch tooltips.
NrbMultiLineChart(
  height: 220,
  xAxisLabels: const ["Mon", "Tue", "Wed", "Thu", "Fri", "Sat", "Sun"],
  series: [
    NrbLineSeries(
      label: "Quantity",
      color: Colors.blueAccent,
      data: [64000, 60000, 55000, 50000, 45000, 40000, 35000],
    ),
    NrbLineSeries(
      label: "Lines",
      color: Colors.greenAccent,
      data: [33000, 31000, 29000, 27000, 24000, 22000, 19000],
    ),
  ],
)
Segmented Gauge Chart (KPIs & Scores) #
A highly professional half-circle gauge with customizable color segments, dynamic tick marks, and an animated needle. Perfect for satisfaction scores and target achievements.
NrbGaugeChart(
    value: 71.0, // Target value
    size: 240,
    strokeWidth: 35.0,
    segments: [
        NrbGaugeSegment(startValue: 0, endValue: 50, color: const Color(0xFFF0716A)), // Red
        NrbGaugeSegment(startValue: 50, endValue: 75, color: const Color(0xFFFFCA3A)), // Yellow
        NrbGaugeSegment(startValue: 75, endValue: 100, color: const Color(0xFF67B28C)), // Green
    ],
    centerContent: const Text(
    "71%",
    style: TextStyle(fontWeight: FontWeight.bold, fontSize: 22),
    ),
)
Interactive Scatter Plot (Correlations) #
Plot individual data points on an X/Y plane to visualize correlations. Includes hover/tap tooltips.
    NrbScatterPlot(
    height: 180,
    pointColor: Colors.deepPurpleAccent,
    points: [
        NrbScatterPoint(1, 10),
        NrbScatterPoint(2, 12),
        NrbScatterPoint(3, 15),
        NrbScatterPoint(5, 20),
        NrbScatterPoint(9, 30),
    ],
)
Histogram (Data Distribution) #
Display the continuous distribution of numerical data into bins. Includes interactive tooltips.
NrbHistogram(
    height: 160,
    color: Colors.teal.shade400,
    bins: [
        NrbHistogramBin(label: "18-24", frequency: 150),
        NrbHistogramBin(label: "25-34", frequency: 320),
        NrbHistogramBin(label: "35-44", frequency: 280),
        NrbHistogramBin(label: "45-54", frequency: 190),
    ],
)
Interactive Pie Chart (Distributions) #
A classic pie chart with a satisfying "pop-out" animation when users tap a slice.
NrbPieChart(
    size: 160,
    slices: [
            NrbPieSlice(value: 45, color: const Color(0xFF5C6BC0), label: "Lighting"),
            NrbPieSlice(value: 30, color: const Color(0xFF26A69A), label: "Accessories"),
            NrbPieSlice(value: 25, color: const Color(0xFFFFA726), label: "Others"),
        ],
)
Smooth Line Chart (Area Gradients) #
A sleek, single-variable line chart featuring cubic bezier curves and a gorgeous gradient area fill.
NrbLineChart(
    height: 180,
    showGrid: true,
    lineColor: const Color(0xFF1E88E5),
    lineWidth: 3.0,
    xAxisLabels: const ["M1", "M2", "M3", "M4", "M5"],
    data: [50, 55, 60, 80, 120],
)
Animated Bar Chart #
Clean vertical bar chart with rounded tops, grid lines, and smooth growth animations. Supports interactive tooltips.
NrbBarChart(
    height: 180,
    barColor: const Color(0xFF0B7A3E),
    labels: const ["Jul", "Aug", "Sep", "Oct"],
    data: [120, 150, 180, 220],
)
Donut KPI Card #
A lightweight, circular progress indicator wrapping center text. Excellent for dense dashboards.
NrbDonutChart(
    value: 75.0,
    size: 70,
    progressColor: const Color(0xFF0B7A3E),
    trackColor: Colors.grey.shade200,
    strokeWidth: 8,
    centerContent: const Text("75%"),
)
Animated Metric Card #
A simple, elegant card for displaying a single key metric. Features a smooth, physics-based scaling and fade-in animation on initial load to make your dashboard feel alive.
NrbMetricCard(
  title: "Scheduled",
  value: "142",
  backgroundColor: const Color(0xFF1976D2), // Blue
  textColor: Colors.white,
  width: 120,
  height: 100,
)
📂 Example Output #
📄 License #
© 2025-2026 Innovate Nest Labs
Authors: Mehedi Hasan & Fahad Mia
This software is released under the Innovate Nest Labs Custom License (Proprietary). Integration into personal and commercial applications is fully permitted, subject to the following strict conditions:
- ❌ No Modification: You may not modify, adapt, or create derivative works from the source code.
- ❌ No Redistribution or Resale: You may not redistribute, sub-license, or sell this package as a standalone product or library.
- ✅ Attribution Required: The original copyright notices must remain intact.
See the full LICENSE file in the repository for complete terms and conditions regarding usage and premium API access.
📬 Support & Contributions #
For issues, feature requests, or contributions, feel free to open a GitHub Issue.
Metadata
Documentation
Publisher
Weekly Downloads
Metadata
A highly responsive Flutter table and report builder for complex nested headers, editable data grids, and premium Excel/PDF exports.
License
![]() unknown (license)
unknown (license)
Dependencies
cross_file, flutter, share_plus, web