mapchart 0.5.0  mapchart: ^0.5.0 copied to clipboard
Vector map chart for Flutter. Highly customizable. Compatible with GeoJSON. Pure Flutter.

Map Chart #
- Displays GeoJSON geometries
- Multi resolution with geometry simplification
- Highly customizable
- Interactable
- Pure Flutter (no WebView/JavaScript)
Get started #
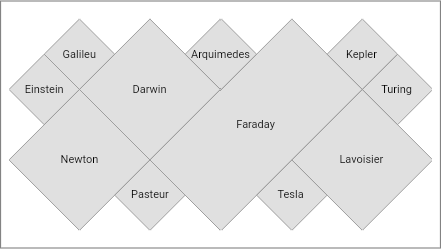
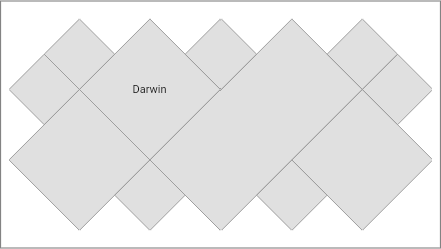
A simplified GeoJSON will be used in the examples to demonstrate the different possibilities of themes. This GeoJSON has only 3 features with the following properties:
| Name | Seq | Rnd |
|---|---|---|
| "Einstein" | 1 | "73" |
| "Newton" | 2 | "92" |
| "Galileu" | 3 | "10" |
| "Darwin" | 4 | |
| "Pasteur" | 5 | "77" |
| "Faraday" | 6 | "32" |
| "Arquimedes" | 7 | "87" |
| "Tesla" | 8 | "17" |
| "Lavoisier" | 9 | |
| "Kepler" | 10 | "32" |
| "Turing" | 11 | "93" |
To view the full content, use this link.
The following examples will assume that GeoJSON has already been loaded into a String.
Reading GeoJSON from String
No properties are loaded, only the geometries.
    MapChartDataSource dataSource =
        await MapChartDataSource.geoJSON(geojson: geojson);
Creating the Widget
MapChart map = MapChart(dataSource: dataSource);
Reading GeoJSON properties
The keys argument defines which properties must be loaded.
The parseToNumber argument defines which properties will have numeric values in quotes parsed to numbers.
    MapChartDataSource dataSource = await MapChartDataSource.geoJSON(
        geojson: geojson, keys: ['Seq', 'Rnd'], parseToNumber: ['Rnd']);
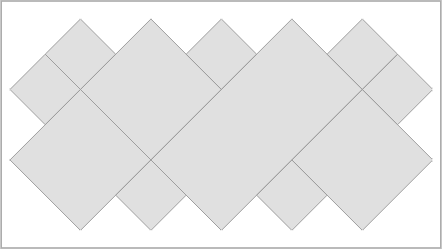
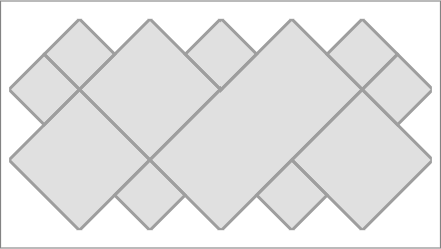
Default colors #
    MapChart map = MapChart(
        dataSource: dataSource,
        theme: MapChartTheme(color: Colors.yellow, contourColor: Colors.red));

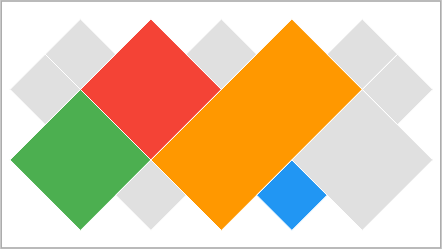
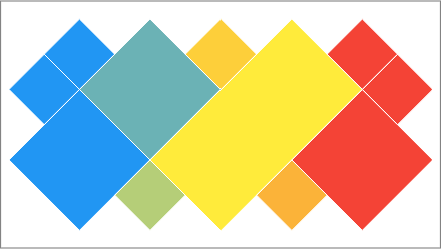
Color by property value #
Sets a color for each property value in GeoJSON. If a color is not set, the default color is used.
Mapping the property key
    MapChartDataSource dataSource =
        await MapChartDataSource.geoJSON(geojson: geojson, keys: ['Seq']);
Setting the colors for the property values
    MapChartTheme theme = MapChartTheme.value(
        contourColor: Colors.white,
        key: 'Seq',
        colors: {
          2: Colors.green,
          4: Colors.red,
          6: Colors.orange,
          8: Colors.blue
        });

    MapChart map = MapChart(dataSource: dataSource, theme: theme);
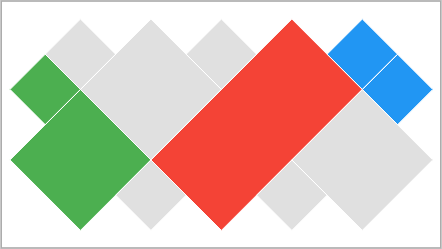
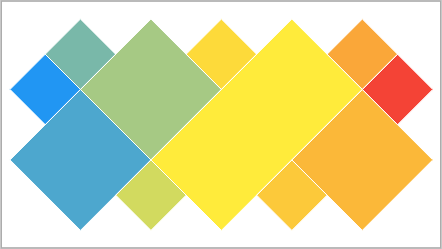
Color by rule #
The feature color is obtained from the first rule that returns a non-null color. If all rules return a null color, the default color is used.
Mapping the property key
    MapChartDataSource dataSource = await MapChartDataSource.geoJSON(
        geojson: geojson, keys: ['Name', 'Seq']);
Setting the rules
    MapChartTheme theme =
        MapChartTheme.rule(contourColor: Colors.white, colorRules: [
      (feature) {
        String? value = feature.getValue('Name');
        return value == 'Faraday' ? Colors.red : null;
      },
      (feature) {
        double? value = feature.getDoubleValue('Seq');
        return value != null && value < 3 ? Colors.green : null;
      },
      (feature) {
        double? value = feature.getDoubleValue('Seq');
        return value != null && value > 9 ? Colors.blue : null;
      }
    ]);

    MapChart map = MapChart(dataSource: dataSource, theme: theme);
Gradient #
The gradient is created given the colors and limit values of the chosen property. The property must have numeric values.
Auto min/max values
Uses the min and max values read from data source.
    MapChartDataSource dataSource =
        await MapChartDataSource.geoJSON(geojson: geojson, keys: ['Seq']);
    MapChartTheme theme = MapChartTheme.gradient(
        contourColor: Colors.white,
        key: 'Seq',
        colors: [Colors.blue, Colors.yellow, Colors.red]);

    MapChart map = MapChart(dataSource: dataSource, theme: theme);
Setting min or max values manually
If the min value is set, all lower values will be displayed using the first gradient color.
If the max value is set, all higher values will be displayed using the last gradient color.
    MapChartDataSource dataSource =
        await MapChartDataSource.geoJSON(geojson: geojson, keys: ['Seq']);
    MapChartTheme theme = MapChartTheme.gradient(
        contourColor: Colors.white,
        key: 'Seq',
        min: 3,
        max: 9,
        colors: [Colors.blue, Colors.yellow, Colors.red]);

    MapChart map = MapChart(dataSource: dataSource, theme: theme);
Contour #
Thickness
MapChart map = MapChart(dataSource: dataSource, contourThickness: 3);
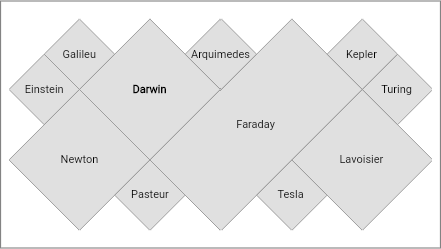
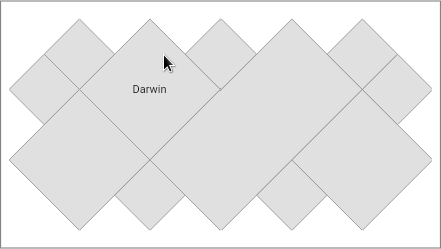
Label #
Mapping label property
    MapChartDataSource dataSource =
        await MapChartDataSource.geoJSON(geojson: geojson, labelKey: 'Name');
Visibility
    MapChart map = MapChart(
        dataSource: dataSource,
        theme: MapChartTheme(labelVisibility: (feature) => true));
    MapChart map = MapChart(
        dataSource: dataSource,
        theme: MapChartTheme(
            labelVisibility: (feature) => feature.label == 'Darwin'));
Style
    MapChart map = MapChart(
        dataSource: dataSource,
        theme: MapChartTheme(
            labelVisibility: (feature) => true,
            labelStyleBuilder: (feature, featureColor, labelColor) {
              if (feature.label == 'Darwin') {
                return TextStyle(
                  color: labelColor,
                  fontWeight: FontWeight.bold,
                  fontSize: 11,
                );
              }
              return TextStyle(
                color: labelColor,
                fontSize: 11,
              );
            }));
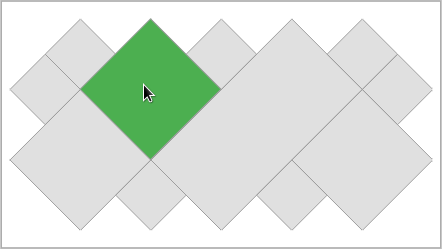
Hover #
Color
    MapChart map = MapChart(
        dataSource: dataSource, hoverTheme: MapChartTheme(color: Colors.green));
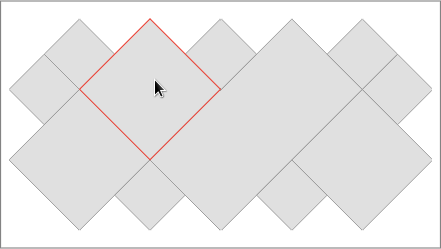
Contour color
    MapChart map = MapChart(
        dataSource: dataSource,
        hoverTheme: MapChartTheme(contourColor: Colors.red));
Label
    MapChartDataSource dataSource =
        await MapChartDataSource.geoJSON(geojson: geojson, labelKey: 'Name');
    MapChart map = MapChart(
        dataSource: dataSource,
        hoverTheme: MapChartTheme(labelVisibility: (feature) => true));
Listener
    MapChart map = MapChart(
        dataSource: dataSource,
        hoverTheme: MapChartTheme(color: Colors.grey[700]),
        hoverListener: (MapFeature? feature) {
          if (feature != null) {
            int id = feature.id;
            print('Hover - Feature id: $id');
          }
        });
Rule
Enabling hover by property value
    MapChartDataSource dataSource =
        await MapChartDataSource.geoJSON(geojson: geojson, keys: ['Seq']);
    // coloring only the 'Darwin' feature
    MapChartTheme theme =
        MapChartTheme.value(key: 'Seq', colors: {4: Colors.green});
    MapChartTheme hoverTheme = MapChartTheme(color: Colors.green[900]!);

    // enabling hover only for the 'Darwin' feature
    MapChart map = MapChart(
      dataSource: dataSource,
      theme: theme,
      hoverTheme: hoverTheme,
      hoverRule: (feature) {
        return feature.getValue('Seq') == 4;
      },
    );
Click listener #
    MapChart map = MapChart(
        dataSource: dataSource,
        hoverTheme: MapChartTheme(color: Colors.grey[800]!),
        clickListener: (feature) {
          print(feature.id);
        });
Agenda for the next few days #
- More theming features.
- Legend.
- Release the final version (1.0.0). The API may have some small changes.
Metadata
Publisher
Metadata
Vector map chart for Flutter. Highly customizable. Compatible with GeoJSON. Pure Flutter.
Repository (GitHub)
View/report issues
License
![]() unknown (LICENSE)
unknown (LICENSE)