Pie Chart 


This Flutter package provides a Pie Chart Widget with cool animation.
More discussions on Discord: https://discord.gg/7byeCn7MGF
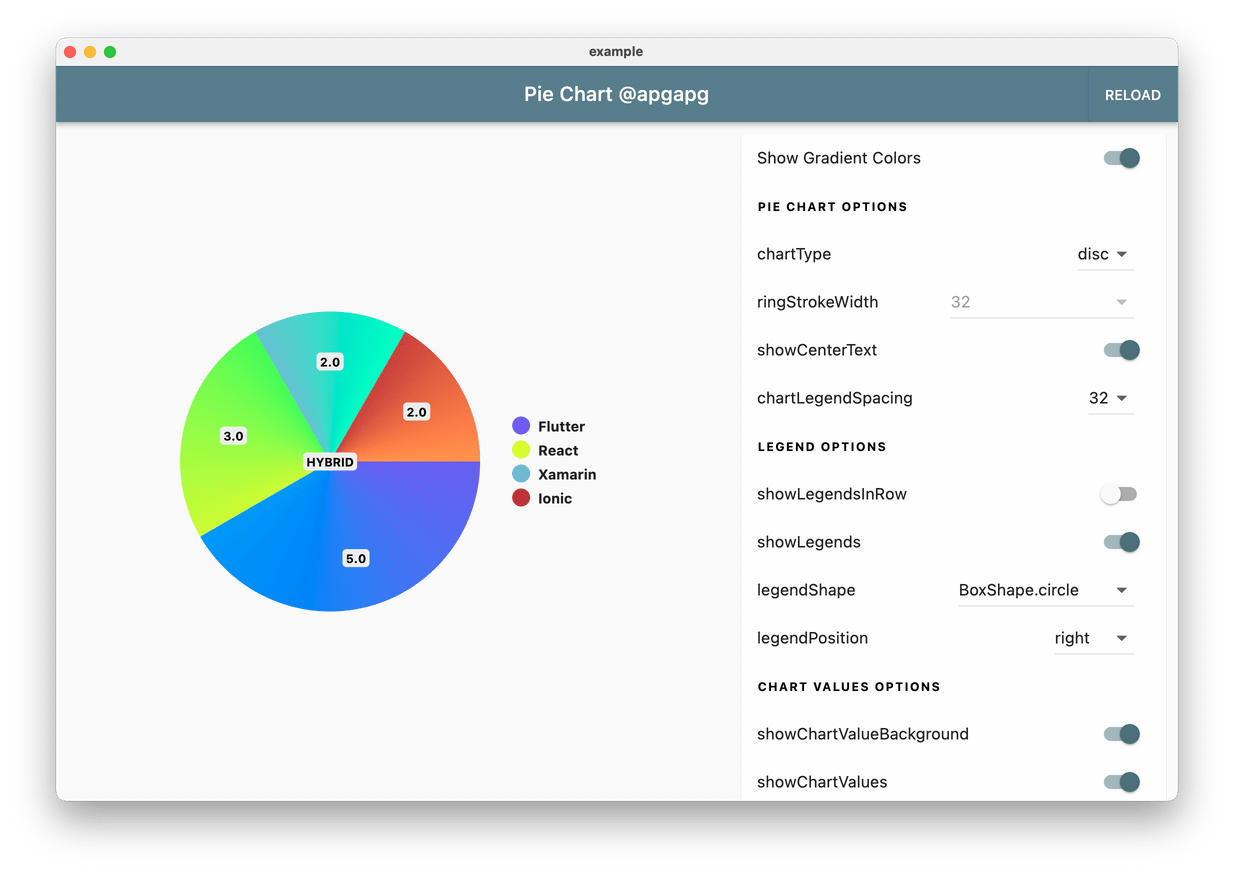
💻 Try LIVE Demo
Live Demo: https://apgapg.github.io/pie_chart/

💻 Installation
In the dependencies: section of your pubspec.yaml, add the following line:

dependencies:
  pie_chart: <latest version>
❔ Usage
Import this class
import 'package:pie_chart/pie_chart.dart';
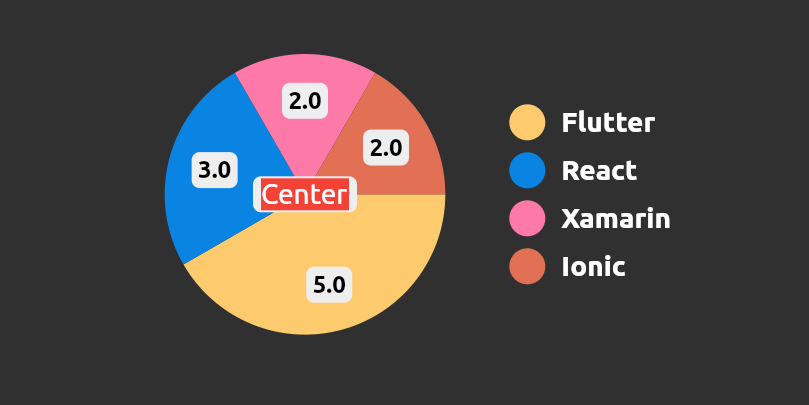
Usage is simple. Pie Chart is a widget and it just need a Map<String,double> as its data input.
Map<String, double> dataMap = {
    "Flutter": 5,
    "React": 3,
    "Xamarin": 2,
    "Ionic": 2,
  };
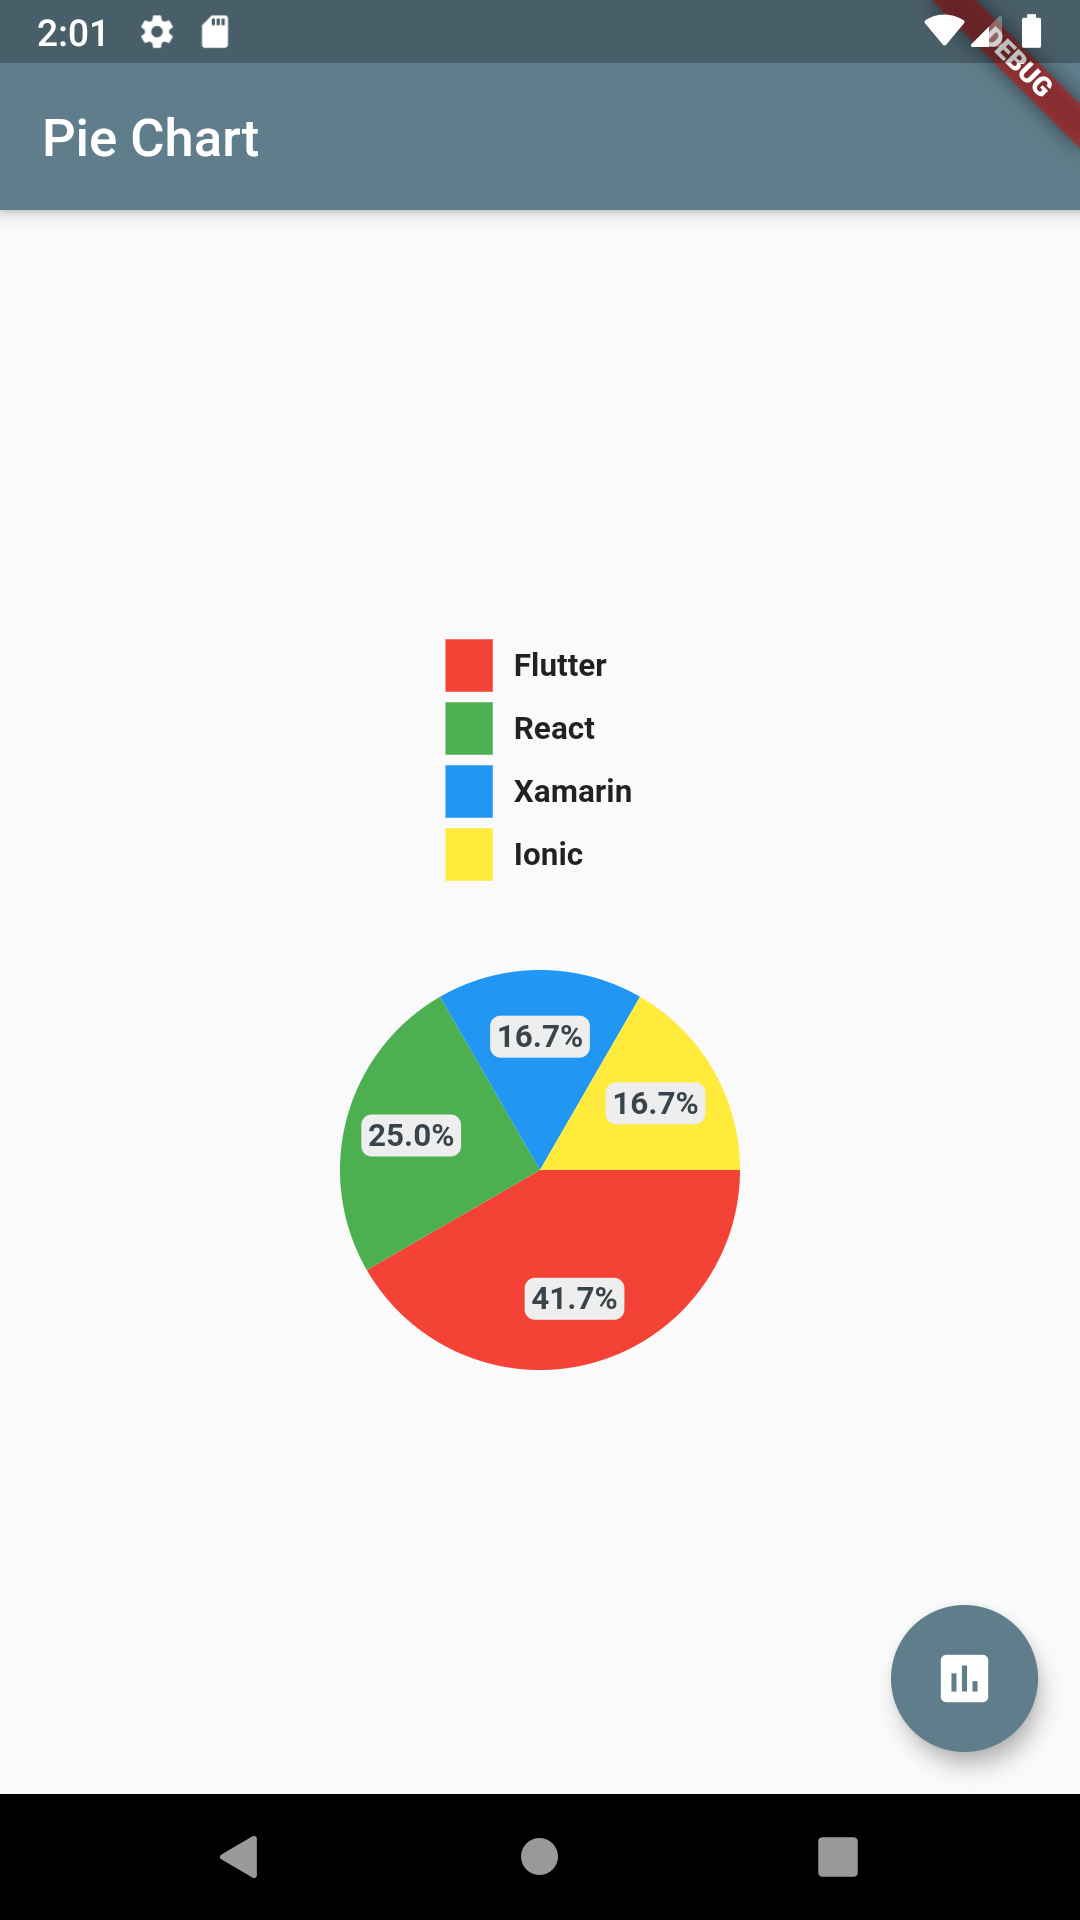
- Simple Implementation
PieChart(dataMap: dataMap)
- Full Implementation
PieChart(
dataMap: dataMap,
animationDuration: Duration(milliseconds: 800),
chartLegendSpacing: 32,
chartRadius: MediaQuery.of(context).size.width / 3.2,
colorList: colorList,
initialAngleInDegree: 0,
chartType: ChartType.ring,
ringStrokeWidth: 32,
centerText: "HYBRID",
legendOptions: LegendOptions(
showLegendsInRow: false,
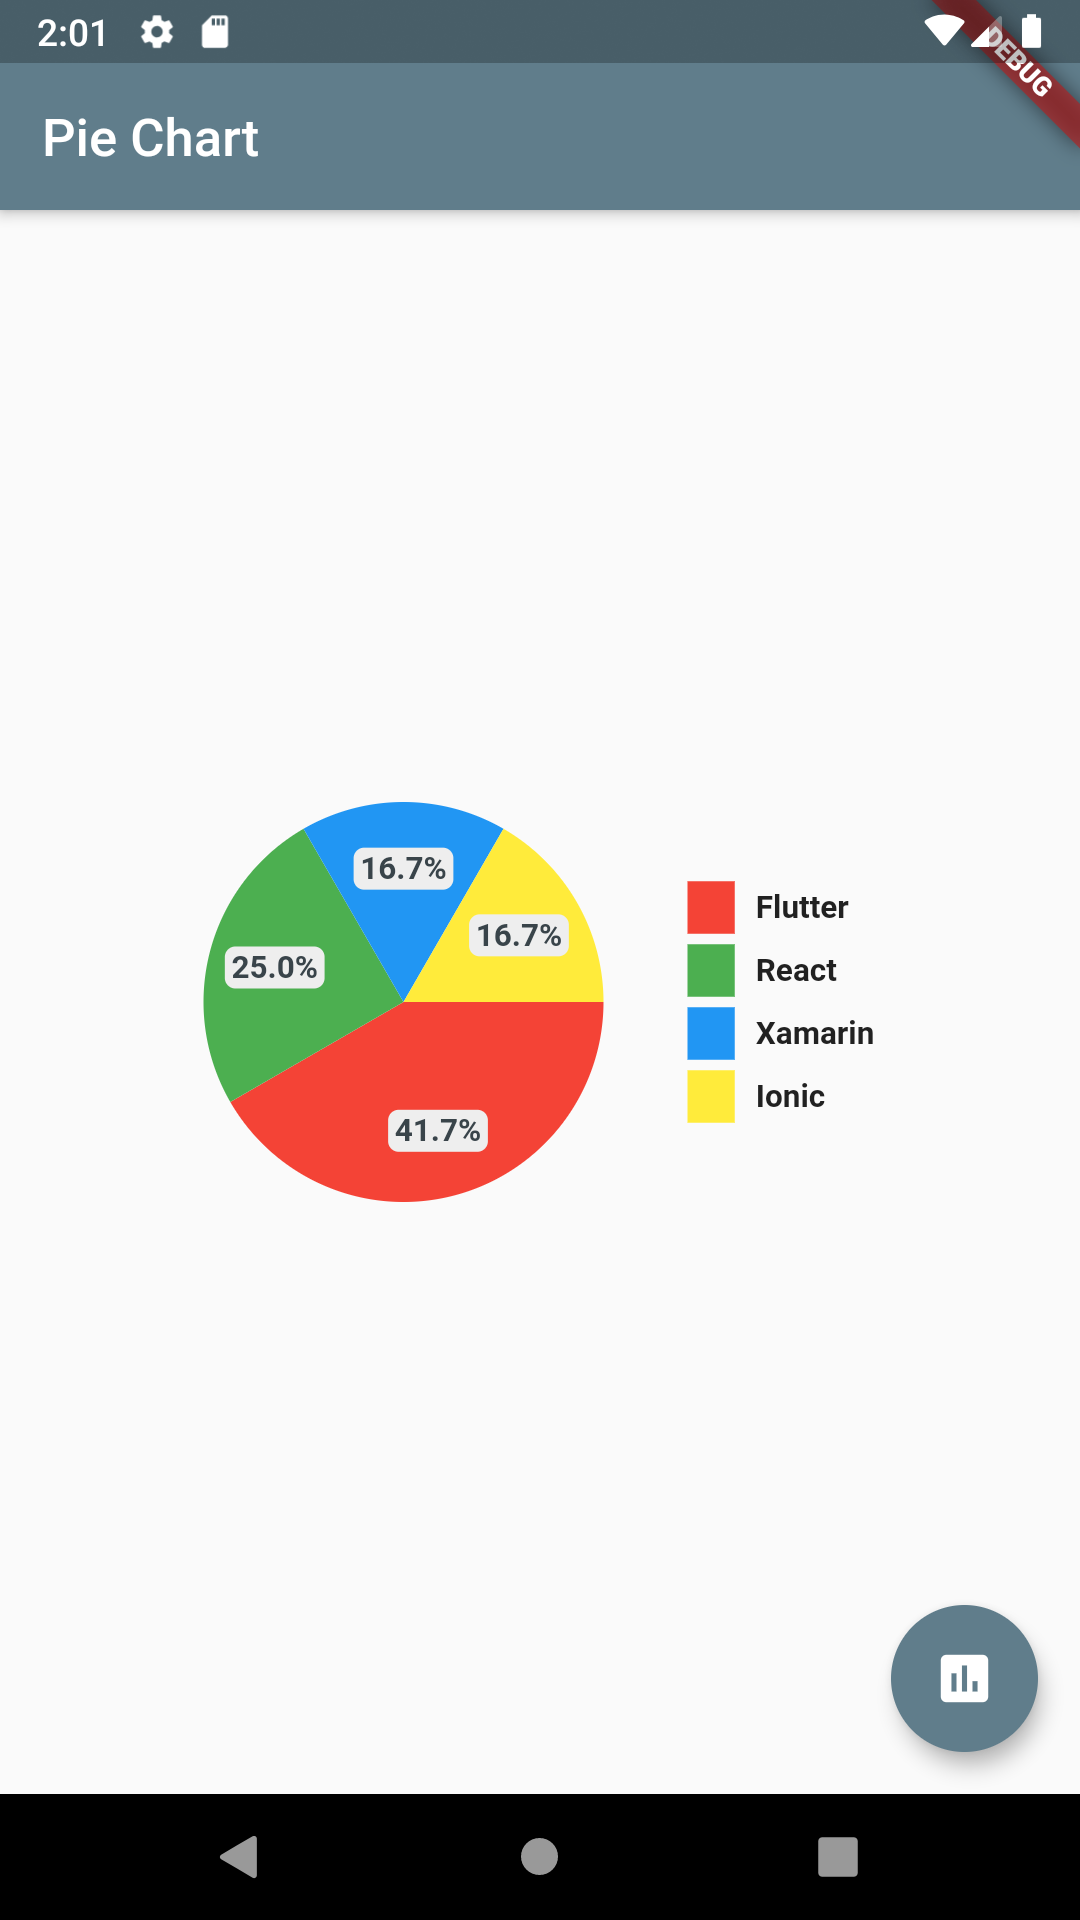
legendPosition: LegendPosition.right,
showLegends: true,
legendShape: _BoxShape.circle,
legendTextStyle: TextStyle(
fontWeight: FontWeight.bold,
),
),
chartValuesOptions: ChartValuesOptions(
showChartValueBackground: true,
showChartValues: true,
showChartValuesInPercentage: false,
showChartValuesOutside: false,
decimalPlaces: 1,
),
// gradientList: ---To add gradient colors---
// emptyColorGradient: ---Empty Color gradient---
)
⭐ Features
Control decimal places 'decimalPlaces'
chartValuesOptions: ChartValuesOptions(
  decimalPlaces: 1,
),
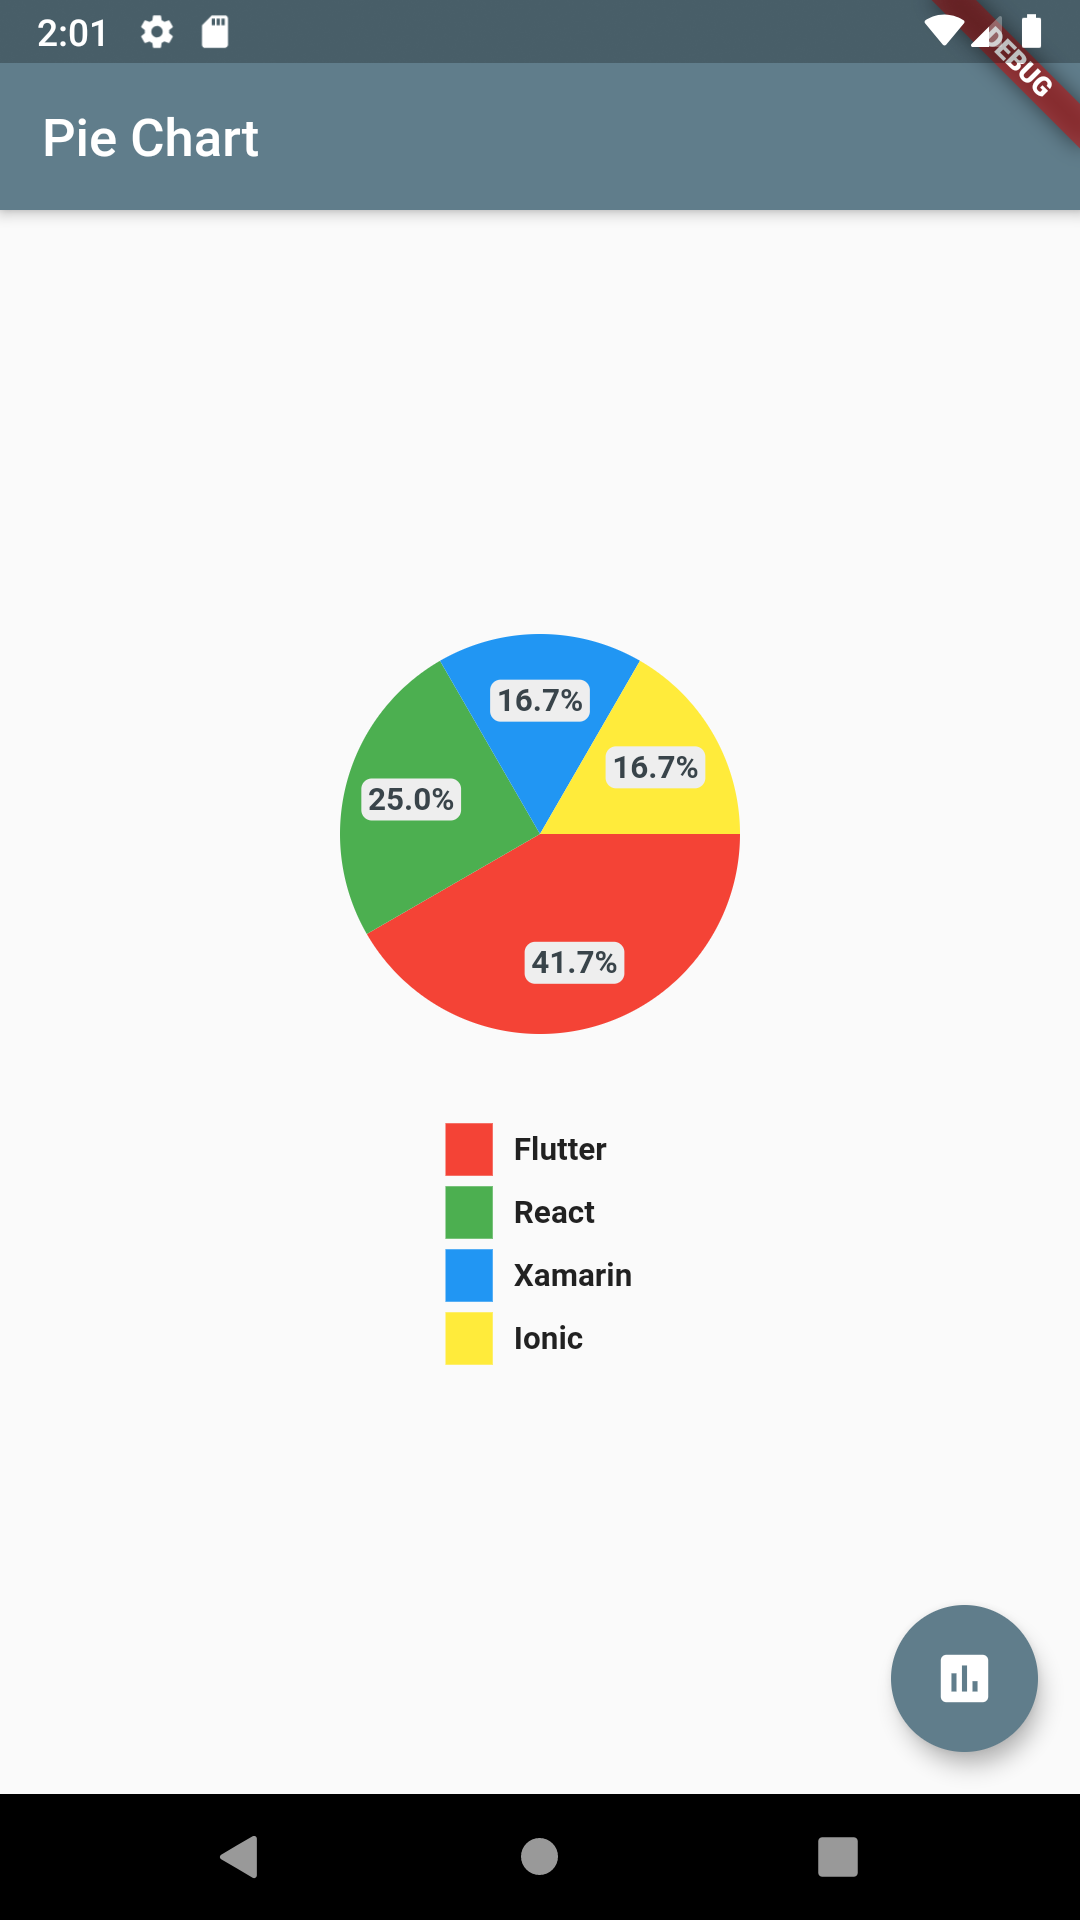
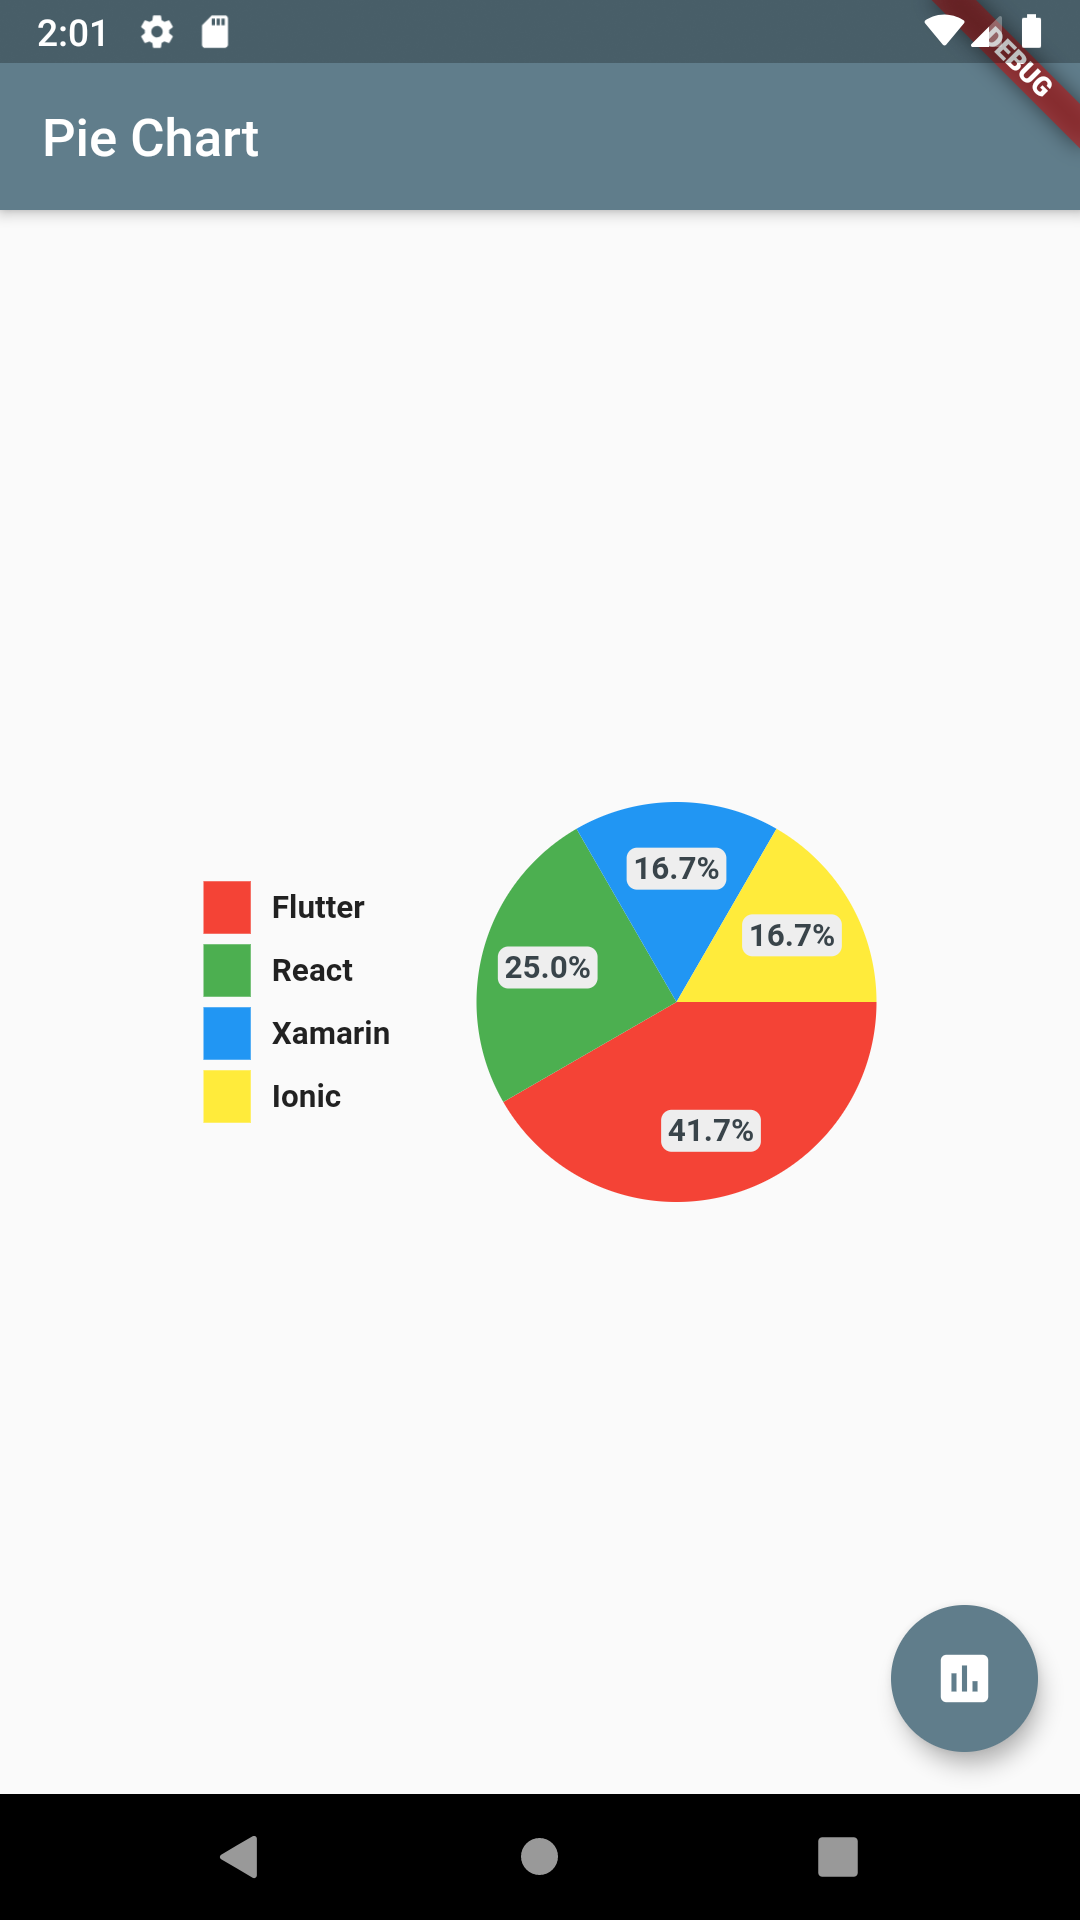
Change legend position with 'legendPosition'
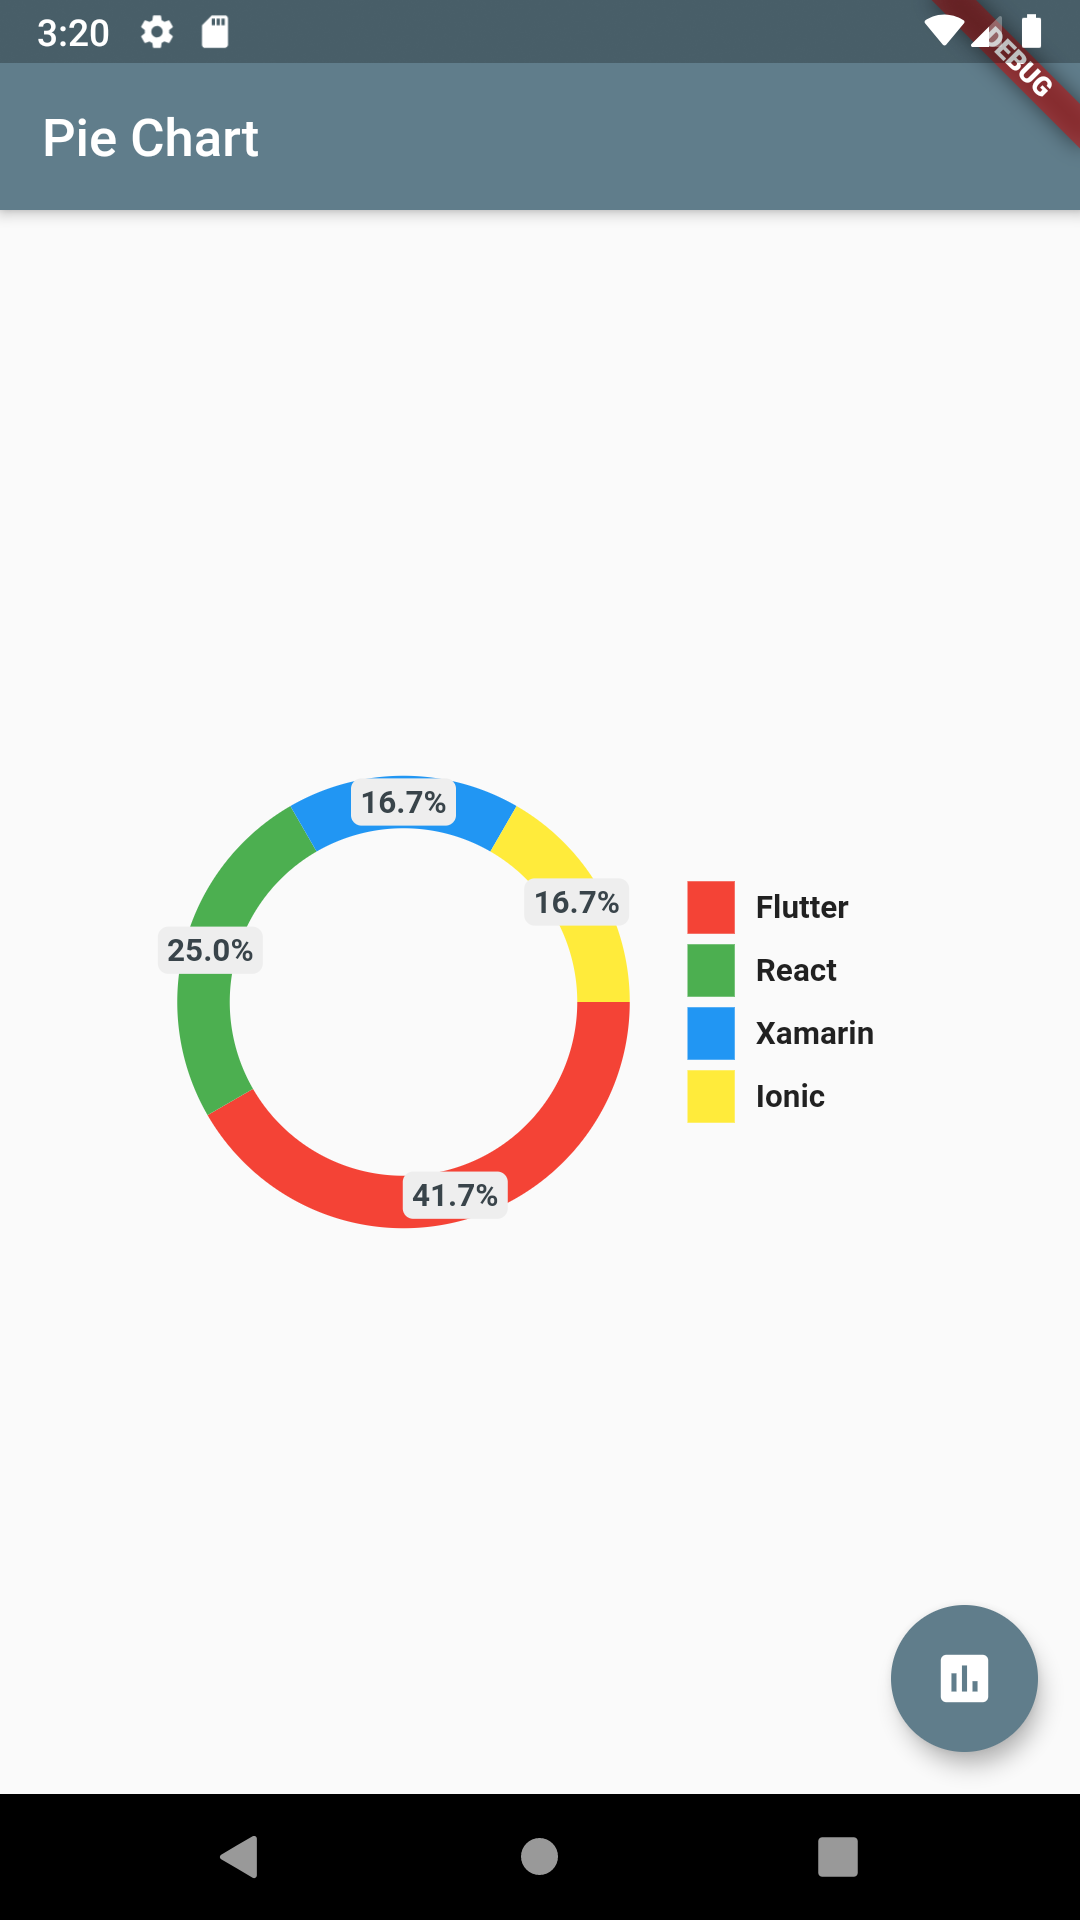
Change Chart shape to ring
chartType: ChartType.ring,
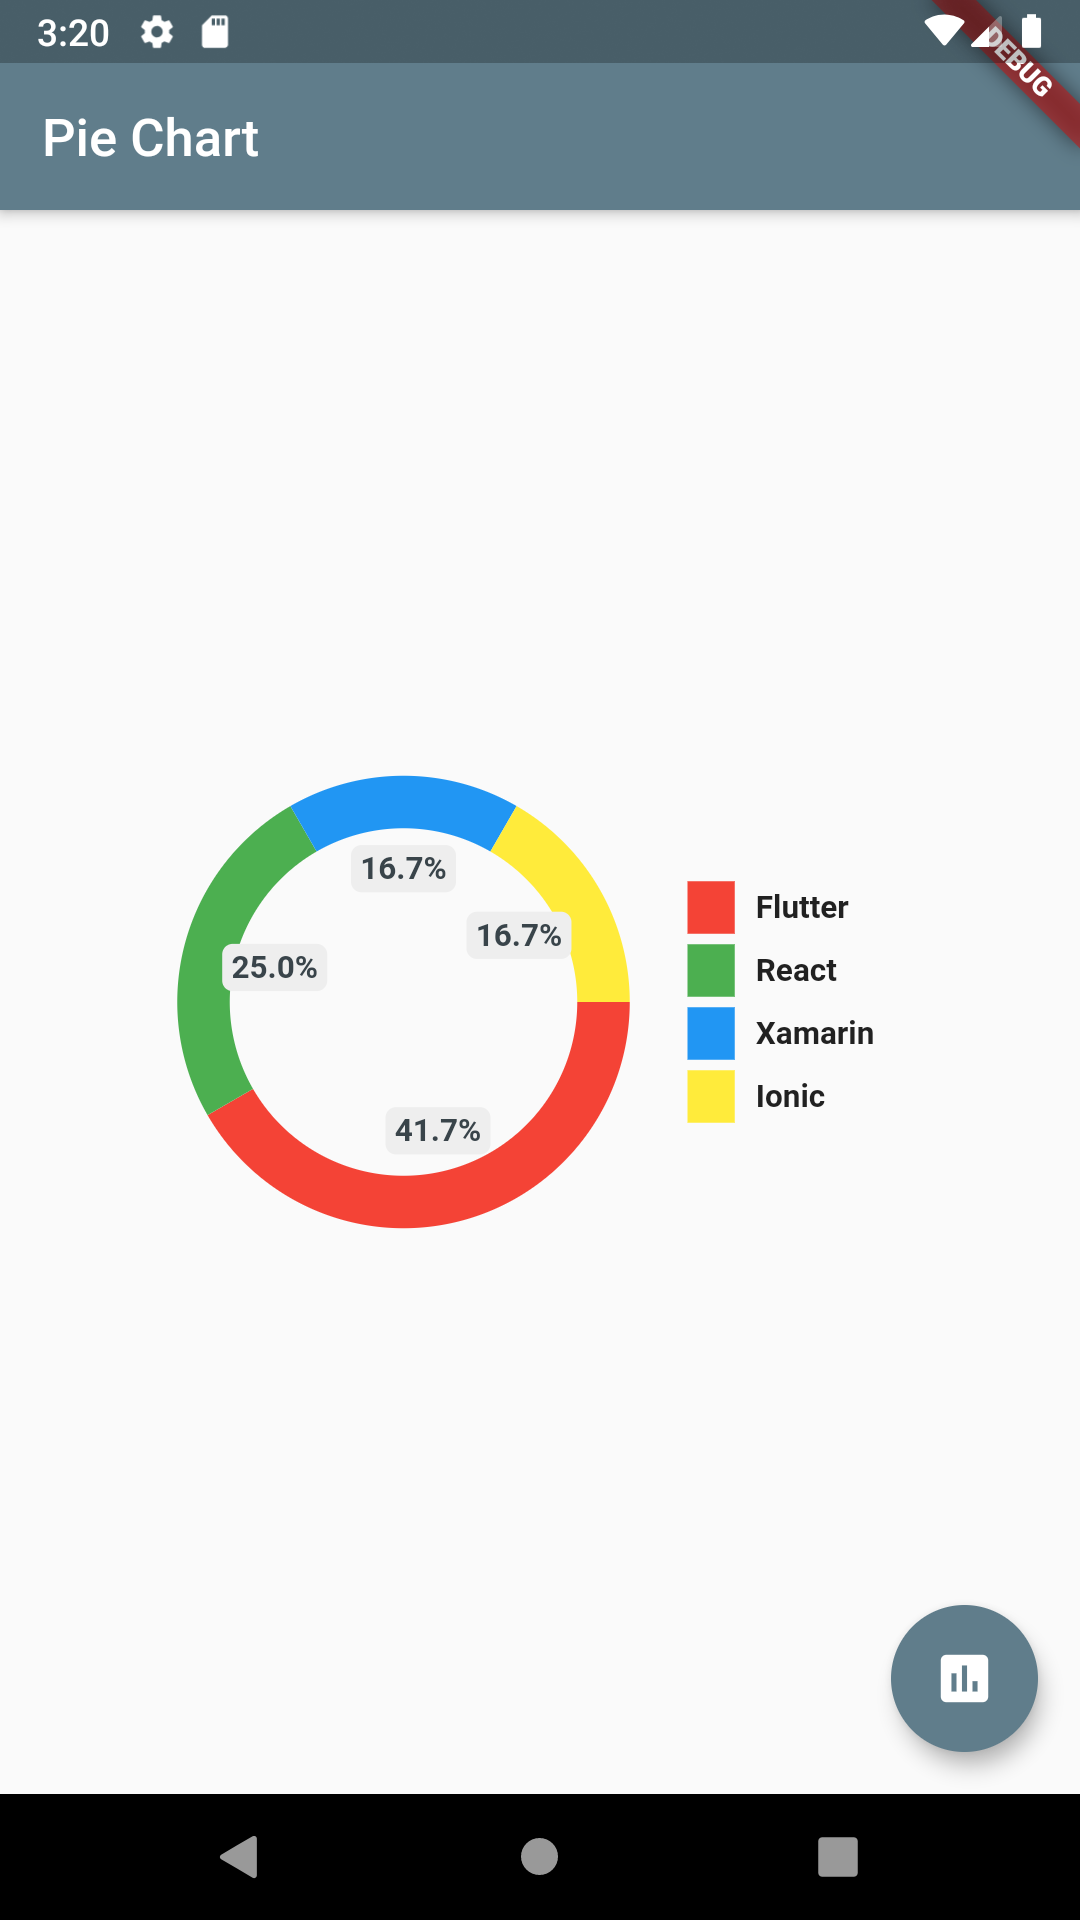
chartType: ChartType.ring,
showChartValuesOutside: true,
Gradient Colors
Pie Chart supports gradient as colors. Just pass gradientList instead of colorList to add gradient to chart colors.
final gradientList = <List<Color>>[
  [
    Color.fromRGBO(223, 250, 92, 1),
    Color.fromRGBO(129, 250, 112, 1),
  ],
  [
    Color.fromRGBO(129, 182, 205, 1),
    Color.fromRGBO(91, 253, 199, 1),
  ],
  [
    Color.fromRGBO(175, 63, 62, 1.0),
    Color.fromRGBO(254, 154, 92, 1),
  ]
];

// Pass gradient to PieChart
gradientList: gradientList,
emptyColorGradient: [
 Color(0xff6c5ce7),
 Colors.blue,
],
Base Chart Color
Add a base pie-chart color via:
baseChartColor: Colors.grey
Full code:
class HomePage2 extends StatelessWidget {
  HomePage2({Key? key}) : super(key: key);

  final dataMap = <String, double>{
    "Flutter": 5,
  };

  final colorList = <Color>[
    Colors.greenAccent,
  ];

  @override
  Widget build(BuildContext context) {
    return Scaffold(
      appBar: AppBar(
        title: Text("Pie Chart 1"),
      ),
      body: Container(
        padding: EdgeInsets.symmetric(horizontal: 16),
        child: PieChart(
          dataMap: dataMap,
          chartType: ChartType.ring,
          baseChartColor: Colors.grey[300]!,
          colorList: colorList,
        ),
      ),
    );
  }
}
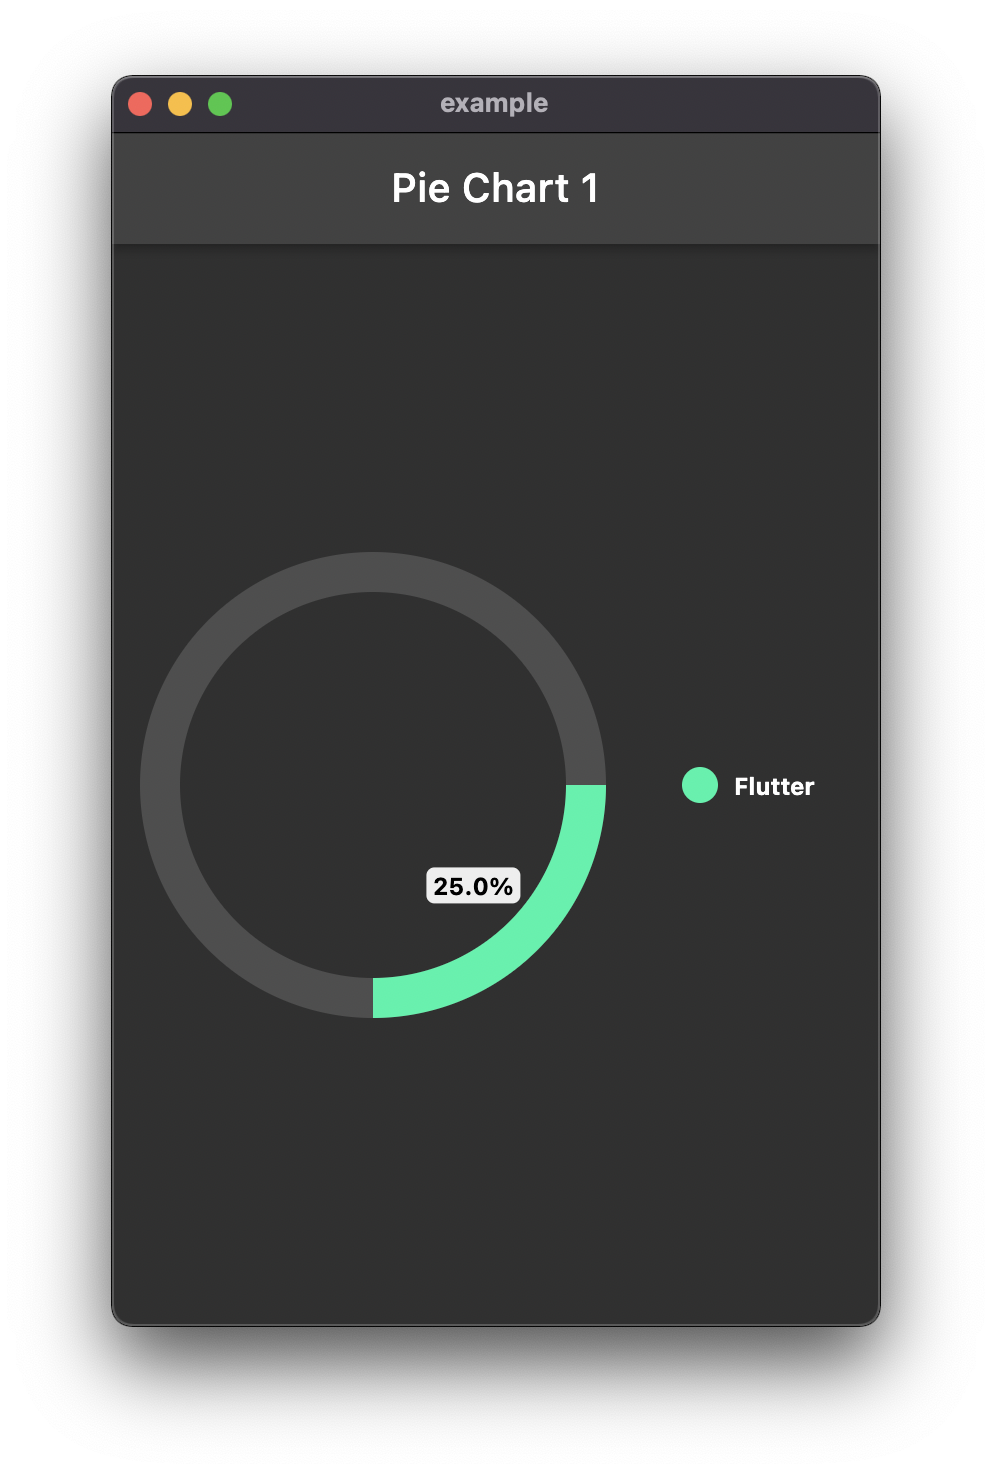
Total Value
To show chart arcs based on your total value, add totalValue option.
class HomePage2 extends StatelessWidget {
  HomePage2({Key? key}) : super(key: key);

  final dataMap = <String, double>{
    "Flutter": 5,
  };

  final colorList = <Color>[
    Colors.greenAccent,
  ];

  @override
  Widget build(BuildContext context) {
    return Scaffold(
      appBar: AppBar(
        title: Text("Pie Chart 1"),
      ),
      body: Container(
        padding: EdgeInsets.symmetric(horizontal: 16),
        child: PieChart(
          dataMap: dataMap,
          chartType: ChartType.ring,
          baseChartColor: Colors.grey[50]!.withOpacity(0.15),
          colorList: colorList,
          chartValuesOptions: ChartValuesOptions(
            showChartValuesInPercentage: true,
          ),
          totalValue: 20,
        ),
      ),
    );
  }
}
Center Widget
Creates a new widget placed at pie chart center
centerWidget: Container(color: Colors.red, child: const Text("Center"))
⭐ My Flutter Packages
- json_table
 Create Flutter Json Table from json map directly.
 - avatar_glow
 Flutter Avatar Glow Widget with glowing animation.
 - search_widget
 Flutter Search Widget for selecting an option from list.
 - animating_location_pin
 Flutter Animating Location Pin Widget providing Animating Location Pin Widget which can be used while fetching device location.
⭐ My Flutter Apps
- flutter_profile
 Showcase My Portfolio: Ayush P Gupta on Playstore.
 - flutter_sankalan
 Flutter App which allows reading/uploading short stories.
👍 Contribution
- Fork it
- Create your feature branch (git checkout -b my-new-feature)
- Commit your changes (git commit -m 'Add some feature')
- Push to the branch (git push origin my-new-feature)
- Create new Pull Request