Perflutter


Performance when building in Flutter is why it is named Perflutter as one word. Perflutter is a lightweight Flutter package to inspect real navigation performance in-app. It helps you detect dropped frames, estimate FPS, observe memory peaks, and understand user journey flow screen by screen.
Why This Package
Smoothness is part of product quality. When frames drop:
- animations stutter
- gestures feel delayed
- users feel the app is "heavy" or unstable
Perflutter gives you live, session-level evidence for where performance pressure happens, so you can fix real bottlenecks faster.
Why Frames Matter
Flutter renders continuously. If UI work or raster work exceeds the frame budget, that frame misses target refresh timing and appears as jank.
- at 60Hz, budget is about
16.67ms - at 120Hz, budget is about
8.33ms - more dropped frames means less smooth experience
This is an early indicator that expensive work is happening on the wrong thread or at the wrong time.
How Perflutter Works
PerflutterNavigatorObserverlistens to route and tab changes.PerflutterTrackerstarts a screen record for the active route.- Flutter
FrameTimingsamples are collected for the current screen. - Frame, dropped-frame, and memory stats are aggregated.
PerflutterTriggeropens a full report overlay on top of your app.
Installation
Add dependency:
dependencies:
  perflutter: ^0.0.5
Setup Step By Step
1) Add Navigator Observer
import 'package:perflutter/perflutter.dart';

MaterialApp(
  navigatorObservers: [
    PerflutterNavigatorObserver(),
  ],
  home: HomePage(),
);
For MaterialApp.router / AutoRoute:
MaterialApp.router(
  routerConfig: _appRouter.config(
    navigatorObservers: () => [
      PerflutterNavigatorObserver(),
    ],
  ),
);
2) Wrap App With Trigger
import 'package:perflutter/perflutter.dart';

MaterialApp(
  builder: (context, child) {
    return PerflutterTrigger(
      triggerMode: PerflutterTriggerMode.floatingButton,
      child: child ?? const SizedBox.shrink(),
    );
  },
);
3) Open Report
floatingButton: tap the floatingButton
or
longPress: long-press anywhere to open
Configurable Attributes
PerflutterTrigger parameters
child(Widget, required): your app content.enabled(bool, optional, defaulttrue): enables/disables the whole feature.triggerMode(PerflutterTriggerMode?, optional): access entry mode.PerflutterTriggerMode.floatingButtonPerflutterTriggerMode.longPress
Example:
PerflutterTrigger(
  enabled: true,
  triggerMode: PerflutterTriggerMode.floatingButton,
  child: child ?? const SizedBox.shrink(),
)
Other public API you may use directly
PerflutterNavigatorObserver(): attach to navigator observers for route tracking.PerflutterReportScreen(onClose: ...): report widget with optional close callback.
Trigger Behavior
- Floating trigger is draggable (
onPanUpdate) so you can move it away from important UI. - Floating trigger uses opacity (
0.5) so it does not heavily hide content. - Trigger mode can be changed from report
Settingsat runtime. - Report opens as an overlay screen on top of current app content.
Production Note
Disable Perflutter in production builds.
Recommended pattern:
import 'package:flutter/foundation.dart';
import 'package:perflutter/perflutter.dart';

MaterialApp(
  navigatorObservers: kDebugMode ? [PerflutterNavigatorObserver()] : const [],
  builder: (context, child) {
    return PerflutterTrigger(
      enabled: kDebugMode,
      triggerMode: PerflutterTriggerMode.floatingButton,
      child: child ?? const SizedBox.shrink(),
    );
  },
);
This keeps performance instrumentation for development/testing only.
Report Screen Overview
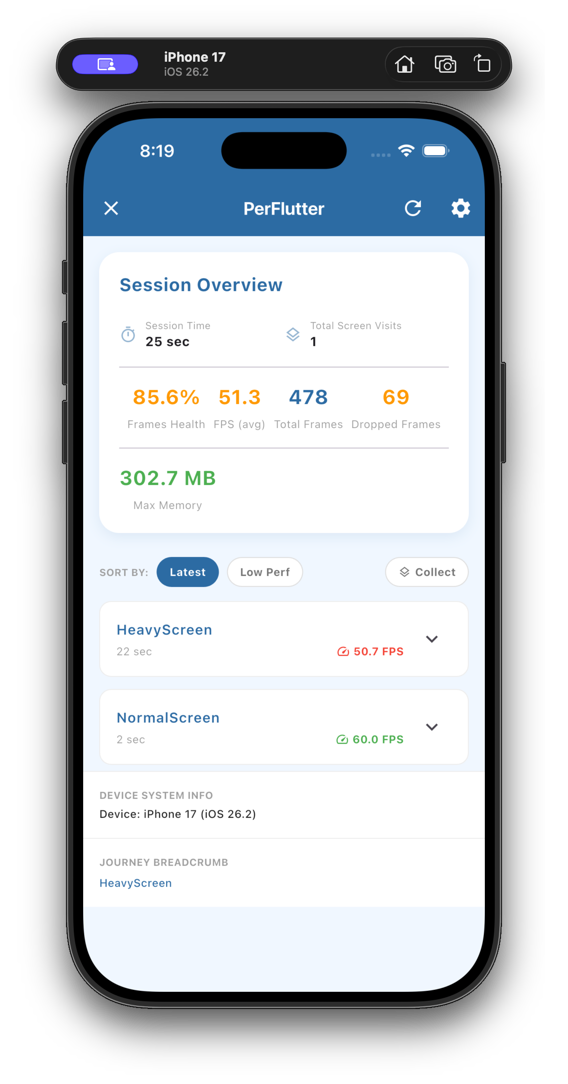
The report contains:
- Session Overview
- Sort + Collect controls
- Per-screen cards
- Device System Info
- Journey Breadcrumb
On every open, the first screen card is expanded by default for quick inspection.
Session Overview Numbers
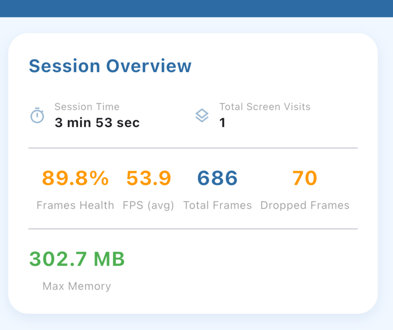
Session Time: how long the current tracking session has been running.Total Screen Visits: how many screen visits were tracked in this session.Total Frames: all rendered frames captured during the session.Dropped Frames: frames that missed smooth rendering targets.Frames Health %: overall smoothness score for the session.FPS (avg): average rendered frames per second for the session.Max Memory: highest memory usage observed in the session.
Per-Screen Card Numbers
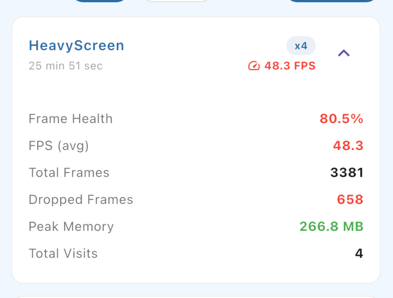 Each screen card shows:
- screen name
- duration for that visit (or aggregated duration in collect mode)
- estimated FPS
- frame health
- total frames
- dropped frames
- peak memory
- total visits (
xN) only when collect mode is enabled
Color Meaning
Performance color (by drop rate):
- green:
< 5% - orange:
5%to< 15% - red:
>= 15%
Memory color (by MB):
- green:
< 350 - orange:
350to< 600 - red:
>= 600
Sort And Collect
Sort:
Latest: newest entries firstLow Perf: highest dropped-frame ratio first
Collect button:
Collect(off): show each visit separatelyCollected(on): merge same screen names into one aggregated card- in collected mode, visits are merged and
Total Visitsis shown - collect toggle state is kept during the current app session
Journey Breadcrumb
Journey section shows navigation order for the session, like:
Home > HeavyScreen > NormalScreen
Use it to correlate performance issues with the user path that led to them.
Device System Info
Shows current device descriptor:
- Android:
manufacturer + model + Android version - iOS:
device name + system name + system version
This helps you compare performance behavior by device class and OS version.
All Buttons Explained
Trigger FAB: open reportClose (X): close report and return to appRefresh: reset tracking session dataSettings: switch trigger mode (Floating Button/Long Press)Sort chips: change orderingCollect chip: toggle per-visit vs per-screen aggregation
Example App In This Repository
The demo app (example/lib/main.dart) includes:
| Normal Screen: Moderate rendering workload. |
Heavy Screen: Raster-heavy animated layers with stress levels. |
|---|---|
 |
 |
Use them to validate that metrics react clearly to lighter vs heavier rendering pressure.
Libraries
- Perflutter public API exports.