flutter_sales_graph
A Flutter package for displaying customizable bar charts for sales data.
Features
- Displays a bar chart with customizable bar appearance and layout.
- Supports different time ranges (e.g., Last 7 Days, Last 30 Days, Last 12 Months).
- Customizable parameters for bar height, width, colors, and labels.
Platforms Supported
- Android: Yes
- iOS: Yes
- Web: Yes
- Windows: Yes
- macOS: Yes
- Linux: Yes
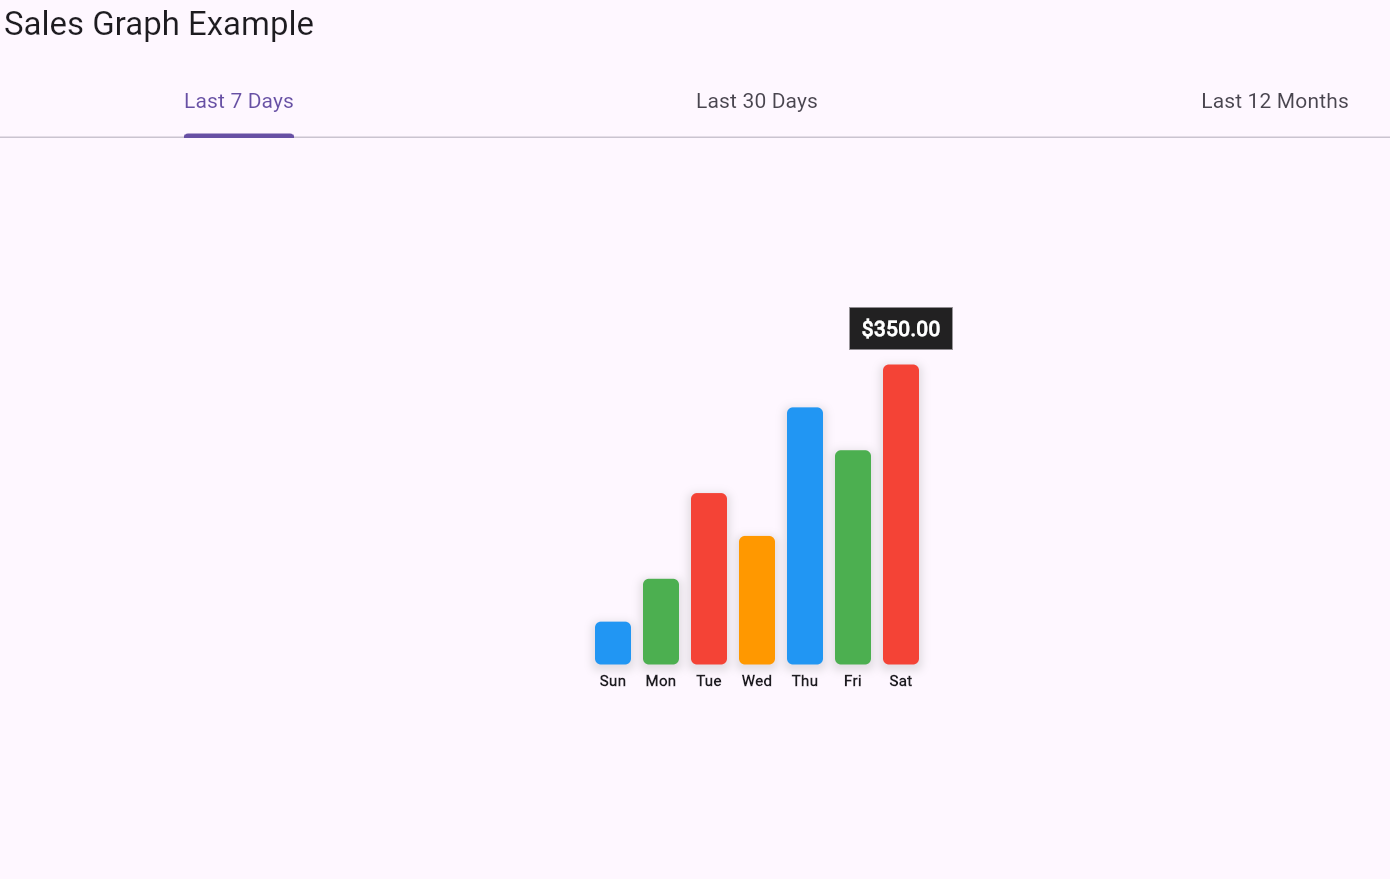
Screenshot
Installation
To use the flutter_sales_graph package in your Flutter project, follow these steps:
-
Add
flutter_sales_graphto yourpubspec.yamlfile:dependencies: flutter_sales_graph: ^0.0.1 -
Run
flutter pub getto install the package.
Usage
Here’s a basic example of how to use the FlutterSalesGraph widget in your Flutter app:
-
Import the package:
import 'package:flutter_sales_graph/flutter_sales_graph.dart'; -
Use the
FlutterSalesGraphwidget:import 'package:flutter/material.dart'; import 'package:flutter_sales_graph/flutter_sales_graph.dart'; void main() { runApp(MyApp()); } class MyApp extends StatelessWidget { @override Widget build(BuildContext context) { return MaterialApp( home: Scaffold( appBar: AppBar(title: Text('Sales Graph Example')), body: Center( child: FlutterSalesGraph( salesData: [100, 200, 150, 300, 250, 350], labels: ['Jan', 'Feb', 'Mar', 'Apr', 'May', 'Jun'], maxBarHeight: 250.0, barWidth: 30.0, colors: [Colors.blue, Colors.green, Colors.red], dateLineHeight: 20.0, ), ), ), ); } }
Parameters
salesData: AList<double>representing the sales values. Must be non-empty.labels: AList<String>representing the labels corresponding to each bar. Must be non-empty and the same length assalesData.selectedRange: AStringto indicate the selected time range for the graph. (For display purposes; not functional in this package).maxBarHeight: Adoublespecifying the maximum height of the bars in the graph.barWidth: Adoublespecifying the width of each bar in the graph.colors: AList<Color>providing the colors for the bars.dateLineHeight: Adoublespecifying the height of the labels below the bars.
Example
For a full example of how to use this package, see the example directory in the GitHub repository.
Development
If you’d like to contribute to this package, please follow these guidelines:
-
Fork the repository:
- Click the "Fork" button on the top-right corner of github page.
-
Clone your fork:
git clone https://github.com/AsherAyub80/flutter_sales_graph.git -
Create a branch for your changes:
git checkout -b feature/your-feature-name -
Make your changes and commit them:
git add . git commit -m "Add feature: your feature description" -
Push your changes:
git push origin feature/your-feature-name -
Create a pull request:
Go to the repository on GitHub and click the "New Pull Request" button.