flutter_web_chartjs 0.2.5  flutter_web_chartjs: ^0.2.5 copied to clipboard
A ChartJS wrapper for Flutter Web. flutter_web_chartjs use the HtmlElementView to render the ChartJS canvas as a Flutter Web widget.
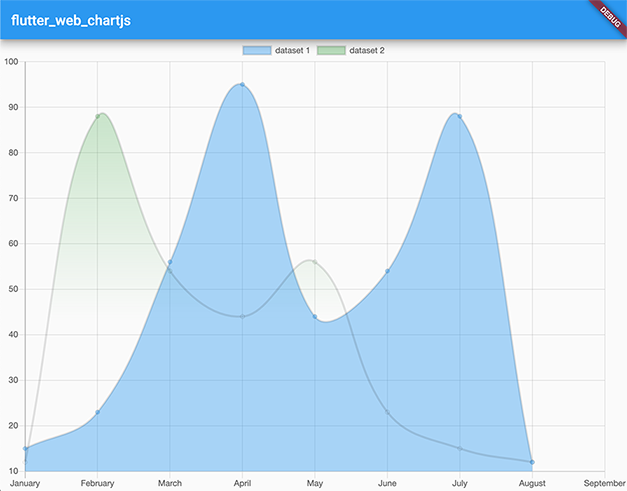
A ChartJS wrapper for Flutter Web.
This project will be lightly maintained by the original author. Contributions are welcome.
Warning:: This plugin still under development.
Getting Started #
Include in your pubspec.yaml:
dependencies:
   flutter_web_chartjs: ^0.2.5
Open your web/index.html file, and include this lines to your head tag:
<!-- this is the chartjs library - you can use other chartjs versions if you needed -->
<script  src="https://cdn.jsdelivr.net/gh/vramosx/flutter_web_chartjs@v0.2.5-alpha/js/chart.min.js"></script>

<!-- this is a js to communicate with flutter -->
<script  src="https://cdn.jsdelivr.net/gh/vramosx/flutter_web_chartjs@v0.2.5-alpha/js/chartjs.wrapper.utils.min.js"  type="application/javascript"></script>
Usage #
This library re-creates the ChartJS configuration, with Flutter classes. You can use the ChartJS documentation to learn how to use. (chartjs documentation)
Every configuration of ChartJS exists in this package with the prefix 'Chart', example:
- WARNING: Some configuration of ChartJS still on development
ChartJS - Javascript:
var myChart = new Chart(ctx, {
     type: 'bar',
     data: barChartData,
     options: {
		responsive: true,
		legend: {
			position: 'top',
		}
	}
});
ChartJS - Flutter Web:
@override
Widget build(BuildContext context) {
    return ChartJS(
    id: 'my-chart' // you need to set a unique id
    config: ChartConfig(
        type: ChartType.line,
        options: ChartOptions(
            responsive: true,
            legend: ChartLegend(
            position: ChartLegendPosition.top
            ),
        ),
    data: ChartData(
            labels: [
                'January',
                'February',
                'March',
                'April',
                'May',
                'June',
                'July',
                'August',
                'September'
            ],
            datasets: [
                ChartDataset(
                    data: [15,23,56,95,44,54,88,12],
                    label: 'dataset 1',
                    backgroundColor:  Colors.blue.withOpacity(0.4)
                )
            ]
        )
     );
}
Some differences between JS version and Flutter Web version: #
1 - Every literal option(string) on JS, is a enum on this package:
JS:
new Chart(ctx, {
     type: 'bar' // literal option
     ...
)
Flutter Web:
ChartJS(
    config: ChartConfig(
        type: ChartType.line, // enum of string options
    )
    ...
);
2 - You can use opacity and linear gradient to background and border options:
return ChartJS(
    id: 'my-chart' // you need to set a unique id
    config: ChartConfig(
        type: ChartType.line,
        options: ChartOptions(
            responsive: true,
            legend: ChartLegend(
            position: ChartLegendPosition.top
            ),
        ),
        data: ChartData(
            datasets: [
                    ChartDataset(
                        data: [15,23,56,95,44,54,88,12],
                        label: 'dataset 1',
                        backgroundColor:  Colors.blue.withOpacity(0.4) // background with opacity
                        borderColor: LinearGradient(  // You can use LinearGradient. (only colors and stops properties are supported)
                            colors: [
                                Colors.red,
                                Colors.blue
                            ],
                            stops: [
                                0, 1
                            ]
                        )
                    )
                ]
        )
	);
3 - You can use callback to format the tooltip:
ChartJS(
    ...
    options: ChartOptions(
        tooltip: ChartTooltip(
        intersect:  false,
        mode: ChartTooltipMode.isIndex,
        callbacks:  ChartCallbacks(
        label: (ChartTooltipItem tooltip) {
            // this method will be called from JS side
            // you can use any dart code here
            // and return the string of tooltip
            return  'R\$ ${tooltip.value}';
        }
    )
    ...
)
Like?

Thanks for your support! :)
Metadata
Publisher
Metadata
A ChartJS wrapper for Flutter Web. flutter_web_chartjs use the HtmlElementView to render the ChartJS canvas as a Flutter Web widget.
Repository (GitHub)
View/report issues
License
![]() GPL-3.0 (LICENSE)
GPL-3.0 (LICENSE)
Dependencies
flutter, flutter_web_plugins, js